
Figure 5. Flux analysis across multiple tissues.
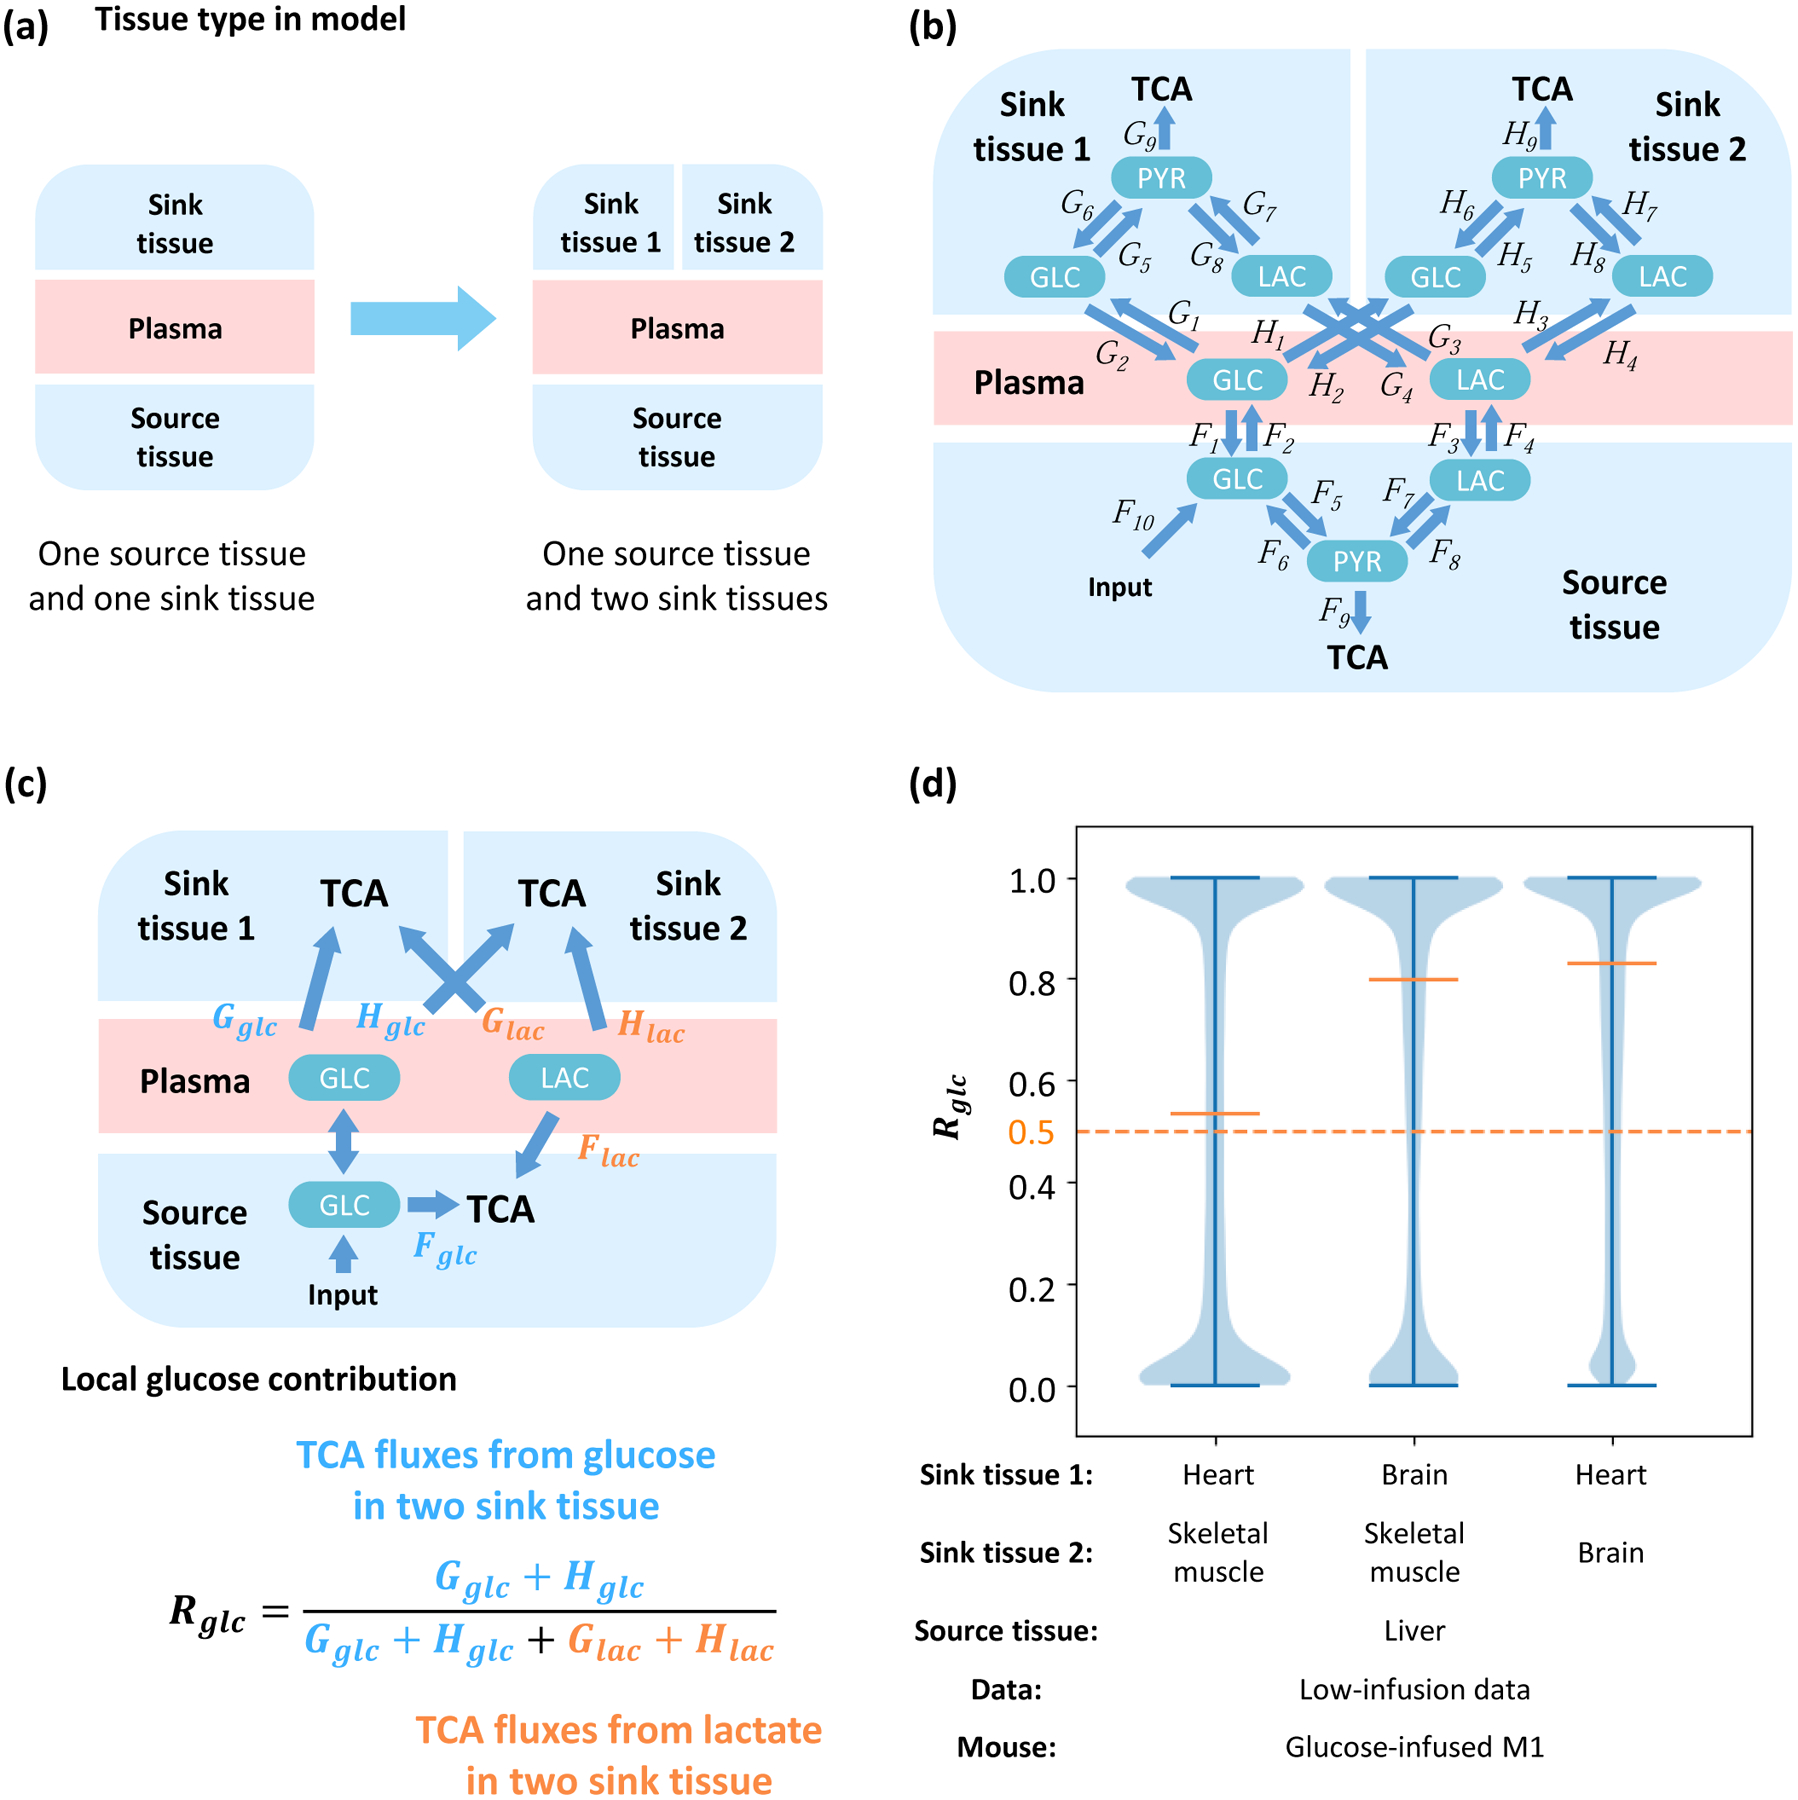
(a) A model with additional sink tissues. (b) Structure of the multi-tissue model. One source tissue and two sink tissues are connected by glucose and lactate in the plasma. (c) Definition of local glucose contribution Rglc. Glucose and lactate can contribute to TCA by Fglc and Flac in the source tissue, Gglc and Glac in the sink tissue 1, and Hglc and Hlac in sink tissue 2, respectively. Direction of net flux between circulating glucose and glucose in source tissue is variable in different solutions. The local glucose contribution is defined as the relative ratio of glucose contribution flux to total contribution flux in two kinds of sink tissue. (d) Distribution of local glucose contribution shows glucose contributes more than lactate to the TCA cycle in all combinations of sink tissues. The model is fit by glucose-infused mouse M1 from the low-infusion data in Hui et al, 2017. The source tissue is liver and the sink tissue 1 and 2 are two from heart, brain and skeletal muscle respectively.