
Figure 6. Model with multiple circulating metabolites feeding the TCA cycle.
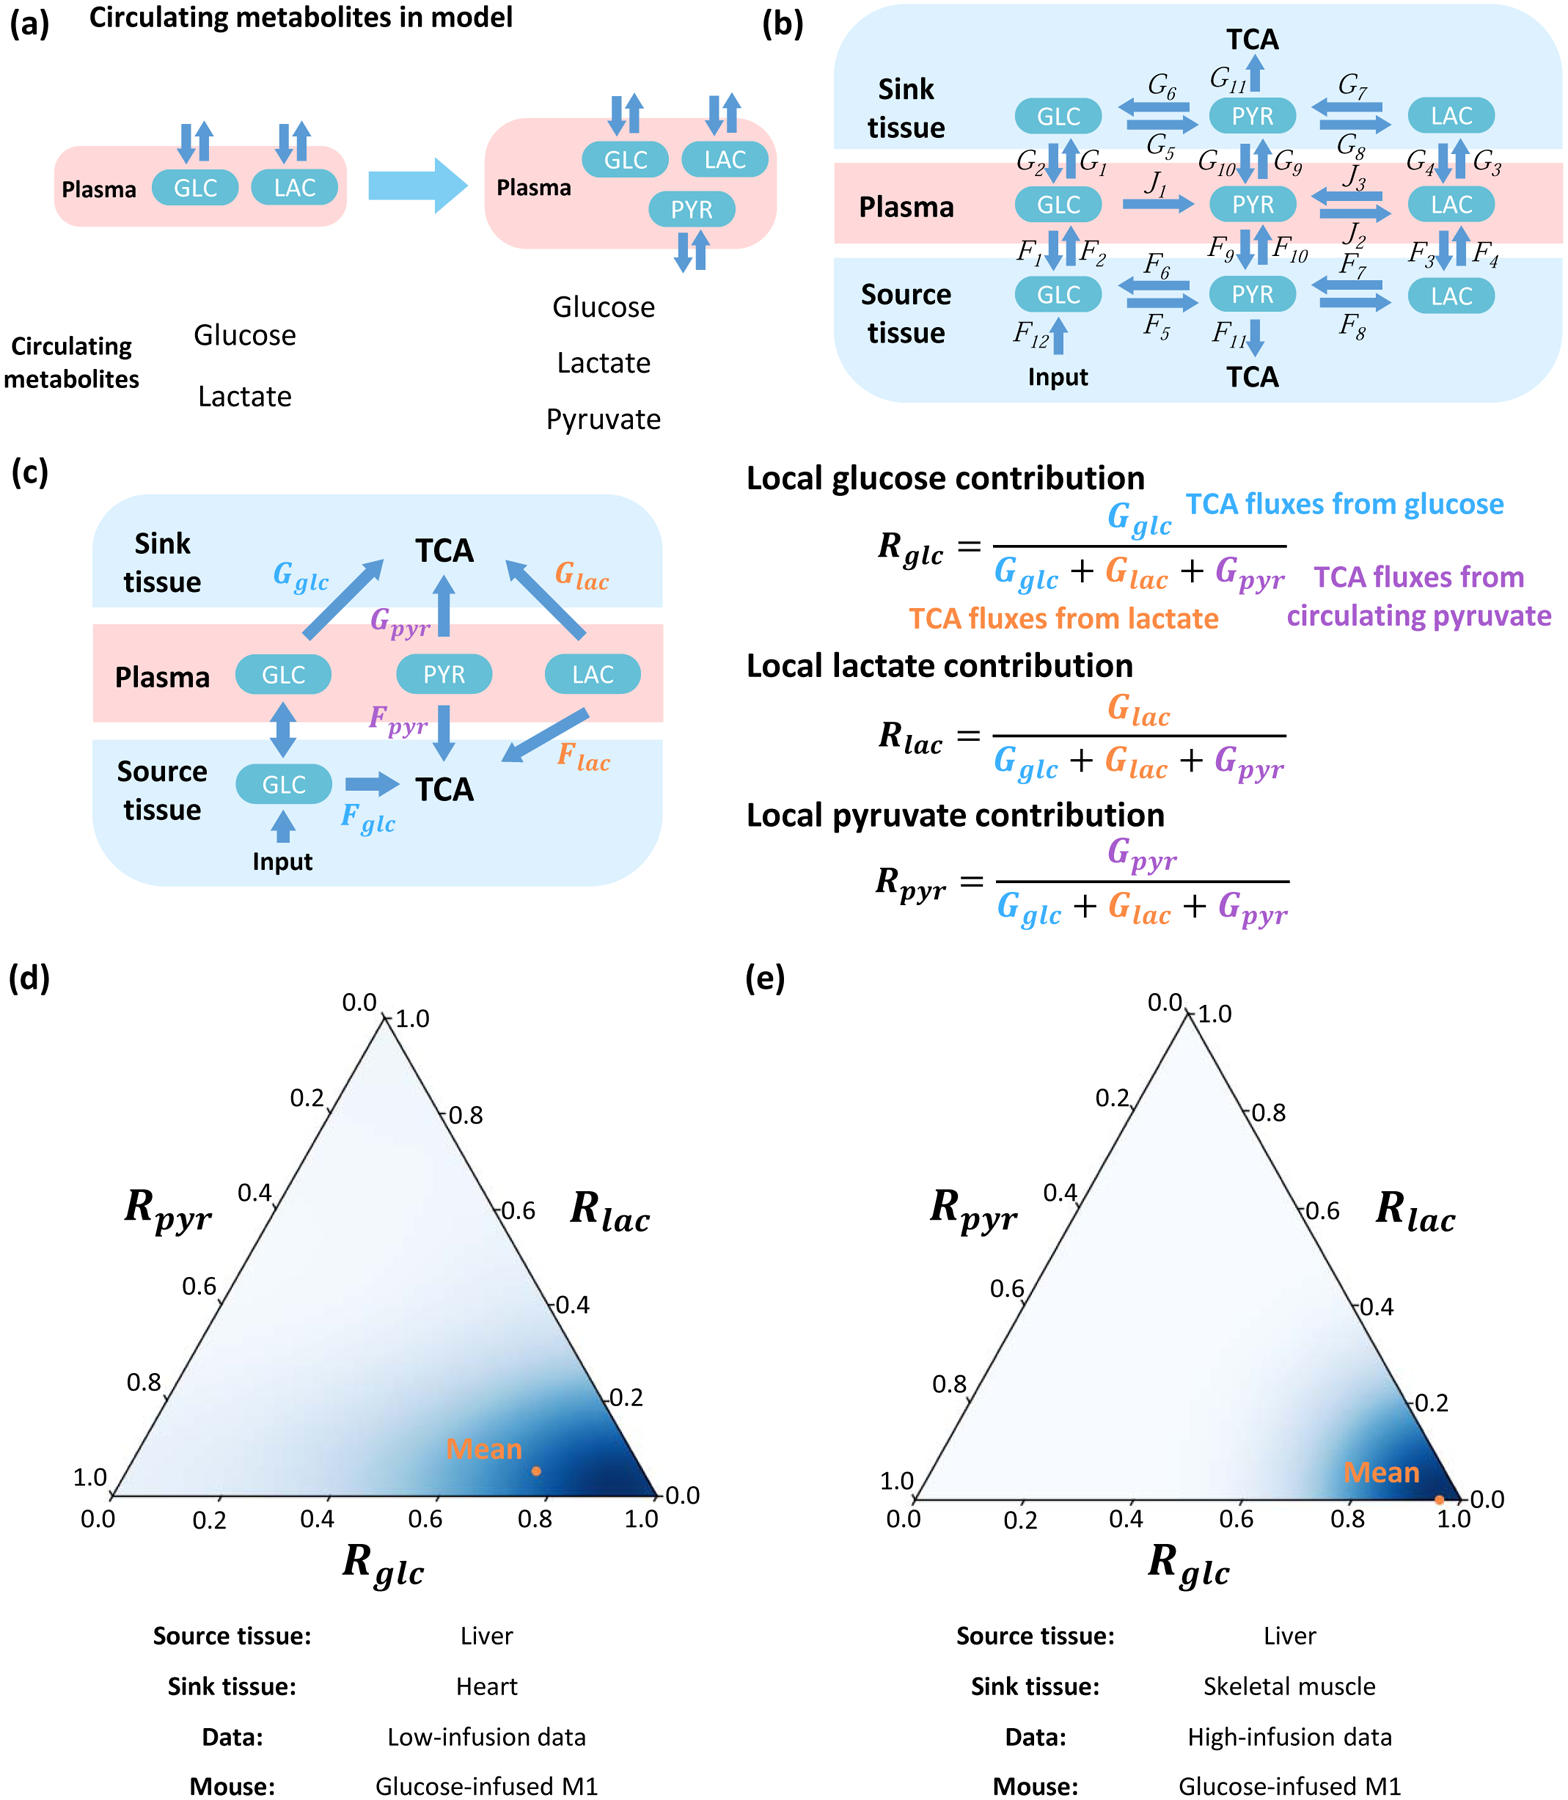
(a) Incorporation of additional circulating metabolites. (b) The structure of the model. The source tissue and sink tissue are connected with glucose, lactate and pyruvate in the plasma. (c) Definition of local contribution from metabolites Rglc, Rlac and Rpyr. Glucose, lactate and pyruvate can contribute to the TCA cycle by Fglc, Flac and Fpyr in source tissue, and Gglc, Glac and Gpyr in the sink tissue. Direction of net flux between circulating glucose and glucose in source tissue is variable in different solutions. The local contribution ratios of three metabolites Rglc, Rlac and Rpyr are defined by the relative ratio of the contribution flux from each metabolite to total contribution flux of all three metabolites in sink tissue. (d) Ternary plot to display distributions of local contributions from three metabolites. The orange point indicates average level. The model is fit by glucose-infused mouse M1 from low-infusion data. The source tissue is liver and sink tissue is heart. (e) Analysis and results as in (d) but for additional high-infusion system of different animal strain, different diet and different infusion protocol. The model is fitted by glucose-infused mouse M1 from the high-infusion data. The source tissue is liver and sink tissue is skeletal muscle.