

Abstract
Emodiversity, or the variety and relative abundance of emotions experienced, provides a metric that can be used to understand emotional experience and its relation to well-being above and beyond average levels of positive and negative affect. Past research has found that more diverse emotional experiences, both positive and negative, are related to better mental and physical health outcomes. The present research aimed to test the relationship between positive and negative emodiversity across the span of 8-days with measures of health and well-being using two samples of the Midlife in the United States study (http://midus.wisc.edu/). Participants (N = 2,788) reported emotional states (14 negative, 13 positive) once each day for 8 days. Emodiversity scores were computed for each day using an adaptation of Shannon’s biodiversity index and averaged across the days. All models included average affect and demographic covariates. Greater positive emodiversity was associated with fewer symptoms of depression and anxiety and fewer physical health symptoms but was not related to eudaimonic well-being nor cognitive functioning. In contrast to previous research, greater negative emodiversity was related to more symptoms of depression and anxiety and more physical symptoms. Greater negative emodiversity was only associated with one positive outcome: better executive functioning. These findings illustrate inconsistencies across studies in whether negative emodiversity is associated with better or worse outcomes and raise further questions about how the construct of emodiversity can be better refined.
Keywords: Emodiversity, health, well-being
Introduction
For decades researchers have examined how positive and negative affect relate to different aspects of adaptive functioning including mental health, well-being, and physical health (e.g., Kahneman, Diener, & Schwarz, 1999; Pressman & Cohen, 2005; Ryan & Deci, 2001; Watson, Clark, & Carey, 1988; Wiese, Chen, Tay, Friedman, & Rector, 2018). Most work on relationships between affect and various aspects of health and well-being has focused on the average level of experienced positive and negative affect. Although informative, emotional experiences are far richer and more complex than summarized mean positive and negative affect indicate, and the information lost when comparing only mean levels may mask signals of critical importance for emotional health. As a result, attention has expanded beyond average affect to better capture the richness and complexity of emotional experiences and its nuanced relationship with well-being (e.g., Grühn, Lumley, Diehl, & Labouvie-Vief, 2013). A variety of emotional complexity measures quantifying the breadth and depth of emotional experiences have been developed. In general, these measures fall into three categories: emotional granularity, emotional covariation, and emotional diversity (Quoidbach et al., 2014). All are thought to provide additional information about a person’s emotional life above and beyond their average levels of positive and negative affect.
Measures of Emotional Complexity
Emotional granularity measures attempt to identify an individual’s ability to verbally label their emotional experience (Lindquist & Barrett, 2008). The weaker the correlation between emotion items described across multiple measurements, the more granular a person’s emotional experience is believed to be. Emotional covariation is the extent to which different emotions are experienced at the same time (Charles, Piazza, & Urban, 2017; Grossmann & Ellsworth, 2017) and is described as a “mixed” emotional experience. A third measure of emotional complexity, emphasized in the present study, examines the diversity of one’s emotional experiences (termed “emodiversity”; Quoidbach et al., 2014). More specifically, emodiversity measures the variety and relative abundance of the emotions experienced. Compared to emotional granularity and covariation, however, a paucity of research exists on how emodiversity is related to different aspects of health and well-being. Thus, the present study aimed to explore the relationship between emodiversity and a variety of health and well-being outcomes.
The theoretical and computational background of emodiversity borrows from the study of biodiversity, which aims to measure the variety (i.e., richness) and relative abundance (i.e., evenness) of different species of organisms living in a given ecosystem. Just as a higher biodiversity score indicates a more diverse ecosystem, a higher emodiversity score indicates a more diverse emotional experience. For example, a person who reports experiencing four different emotions is thought to have a more emotionally diverse experience than another person who reports experiencing only two different emotions over the same period of time.
Just as greater biodiversity is thought to reflect a healthier ecosystem, greater emodiversity is theorized to reflect a healthier emotional life (Quoidbach et al., 2014). For one, experiencing a more diverse range of emotions might indicate emotional flexibility rather than being dominated by any single emotion. Furthermore, life is dynamic and brings about a variety of situations. A person who has the ability to experience a variety of emotions in response to those situations and to adaptively regulate emotion in a context appropriate manner (Davidson, Jackson, & Kalin, 2000) might be better equipped to successfully master such situations. Another possibility is that people who report more diverse emotional experiences might be more aware of, and in touch with, their inner emotional experience. This awareness has been described as self-authenticity and is positively related to mental health and well-being (Ryan, Laguardia, & Rawsthorne, 2005).
Emodiversity and Well-Being
Higher levels of positive affect, and lower levels of negative affect are consistently related to better well-being (Kahneman et al., 1999). The existing emodiversity literature, on the other hand, tends to illustrate that more emodiversity, both positive and negative, is either related to better outcomes, or shows no relationship with the outcomes being measured. Quoidbach and colleagues (2014) first demonstrated that both positive and negative emodiversity were related to lower levels of depression and better objective health (such as number of visits to the doctor and medication consumption) using two large survey samples. These relationships held after adjusting for average levels of positive and negative affect, demonstrating the utility of measuring emodiversity above and beyond a person’s average emotional experience.
A handful of other studies have investigated the relationship between emodiversity and various health and well-being outcomes. Quoidbach and colleagues (2018) replicated the relationship between negative emodiversity and better physical health in an independent survey sample (only negative emodiversity was tested given a lack of positive emotion items). Two other studies provided evidence that positive emodiversity is related to better health indicators, with more positive emodiversity relating to lower levels of inflammation (Ong, Benson, Zautra, & Ram, 2018) and better self-reported physical health (Benson, Ram, Almeida, Zautra, & Ong, 2017), although the relationship in the latter became nonsignificant when mean levels of affect and age were included in the model. In these studies, negative emodiversity was not related to inflammation (Ong et al., 2018) but was related to better self-reported health (only when mean levels of affect and age were included) (Benson et al., 2017). One group has explored the relationship between emodiversity and cognitive abilities, finding that greater global emodiversity (positive and negative combined) is linked to wise reasoning, or a stronger ability to make less biased inferences about the social world (Grossmann, Oakes, & Santos, 2019).
Most research linking emodiversity to well-being is conducted using emotion items measured at a single time point. Examining emodiversity across an extended period of time allows a more representative measurement of the richness and evenness of one’s emotional life. To our knowledge, only three studies have examined emodiversity using multiple measurements across time (Benson et al., 2018 and Ong et al., 2018, discussed earlier; Liu, Bangerter, Rovine, Zarit, & Almeida, 2016). One group examined how the variability of daily negative emodiversity across time (i.e., how much negative emodiversity fluctuates from one day to the next) was related to age, stress, health, and personality using a longitudinal sample from the MIDUS 1 and 2 daily diary studies (Liu et al., 2016). This group was the first to examine the variability of emodiversity across time but did not include an analysis of a person’s average levels of emodiversity across time or examine positive emodiversity. They found that greater fluctuation in negative emodiversity from day to day was related to greater stressor exposure, more physical health symptoms, and higher levels of neuroticism.
Previous emodiversity research is also limited primarily to outcome measures relating to mental or physical health. Thus far no research has explored the relationship between emodiversity and psychological well-being (hedonic nor eudaimonic) which is inherently tied to emotion (Ryan & Deci, 2001); thus, examining how emodiversity relates to both aspects of psychological well-being is a fruitful avenue of research. One group has examined the link between emodiversity and wise reasoning (Grossman et al., 2019), but research on relationships with general cognitive functioning are lacking. Given that cognitive abilities are related to other measures of emotional complexity (Charles et al., 2017; Lindquist & Barrett, 2008), aspects of cognitive functioning may also be related to emodiversity. Individuals with greater executive functioning and/or episodic memory capacity may be better equipped to experience, describe, and recall a diverse range of emotions, which may in turn result in more adaptive mental and physical health outcomes. However, before making inferences about this potential relationship, a link between emodiversity and measures of cognitive functioning must first be established. Therefore, this study examined how both negative and positive emodiversity are related to cognitive function.
The Present Research
The goal of the present research was to test the associations between the positive and negative emodiversity experienced across several days and an array of health and well-being indices. A large sample of participants (N = 2788) reported their emotional experiences one time each day for 8 days. Emodiversity scores were computed for each day, and then averaged across the study period to form an average emodiversity score1. In contrast to previous emodiversity research, we opted to enter positive and negative emodiversity into the same regression models rather than conducting separate regressions for each valence. We were interested in exploring the relationship between emodiversity and well-being outcomes as a function of valence, therefore, entering them in the same model allowed an examination of the unique effects of positive compared to negative emodiversity on health and well-being. Other emodiversity research has also included models using global emodiversity, which reflects emotional diversity measured across valence. We reasoned that including both positive and negative emodiversity in the same model in essence reflects a global emodiversity score, but allows separate, unique inferences to be made for positive and negative emodiversity and is thus more informative than a single measure of global emodiversity. See supplementary material for results of analyses utilizing a global emodiversity metric.
Mental health, psychological well-being, cognitive functioning, and physical health indices were regressed on to emodiversity scores to measure the relationship between experiencing diverse emotions and well-being. Mental and physical health variables were included to conceptually replicate previous emodiversity research. We added psychological well-being and cognitive functioning variables to extend emodiversity research into additional domains of health and well-being. In each model, demographic information, methodological covariates, and average levels of positive and negative affect were included to assess the unique contribution of emodiversity to variance explained in well-being outcomes. As in previous research, we hypothesized that more diversity in (a) positive and (b) negative emotional experiences would relate to fewer symptoms of mental illness (hypotheses 1a-b) and better physical health (hypotheses 2a-b). We further hypothesized that the adaptive relationship between emodiversity and well-being would extend to psychological well-being (hypotheses 3a-b), and cognitive functioning (hypotheses 4a-b) for both positive and negative emodiversity.
Method
Participants
Data were drawn from the Midlife in the United States study (MIDUS; http://midus.wisc.edu/). Two MIDUS samples were used for the present research: the MIDUS sample at wave 2 (M2; collected between 2004 and 2009) and the MIDUS Refresher sample (MR; collected between 2012 and 2016). For the purposes of the present research, individuals were included in analyses if they participated in the daily diary portion of MIDUS and had data for age, gender, education, and all diary emotion metrics (i.e., average positive and negative affect, positive and negative emodiversity; M2: n = 2009; MR: n = 779).
Because a power analysis using the pwr package in R (pwr 1.2-2; Champely, 2018) revealed that a sample of 782 is needed to detect an effect size of R2 = .01 (as reported in Quoidbach et al., 2014) at p = .05 with 80% power, we combined M2 and MR samples for the purposes of enhancing power and utilizing all available data. Although the two samples were collected at different points in time, all items and response formats were mostly identical for both sets of participants. Each regression analysis includes sample origin (M2 or MR) as a covariate. Thus, data from a maximum of 2,788 individuals were included in the present analyses. Due to MIDUS being a multi-project study, sample sizes for each outcome of interest varied between 1,344 and 2,788 depending on which project included measurement of each outcome. Sample sizes for each individual outcome variable are noted where relevant. The overall sample had an average age of 54 years (range: 25-84), was 56.8% female, was primarily White (84.3%; 9.9% Black; 3.5% Other; 1.4% Native American or Alaska Native Aleutian Islander/Eskimo, 0.6% Asian; 0.3% didn’t know or refused) and the majority (71.8%) had more than a high school education.
Measures and Materials
The same measures and materials were used in M2 and MR unless otherwise noted. Multiple measures were used as indicators of the main outcomes of interest (mental health, psychological well-being, cognitive functioning, and physical health). Measures of mental and physical health were selected based on their relevance to past research on emodiversity (so as to provide a conceptual replication) as well as their validity of measuring different aspects of mental and physical health in daily life2. In an effort to expand the existing literature in terms of the breadth of the relationship of emodiversity with health and well-being, variables reflecting overall cognitive functioning (as measured behaviorally) and measures of well-being (both hedonic and eudaimonic aspects) were included. Descriptive statistics of all outcome variables are provided in Table 1.
Table 1.
Descriptive statistics of dependent variables3 for total sample and by MIDUS cohort
| Total Sample | MIDUS 2 | MIDUS Ref | Difference between cohorts |
|||||||||
|---|---|---|---|---|---|---|---|---|---|---|---|---|
| N | Mean | SD | Min | Max | N | Mean | SD | N | Mean | SD | t (df) | |
| CESD Depression | 1,344 | 8.80 | 8.19 | 0.00 | 54.00 | 999 | 8.60 | 8.27 | 345 | 9.40 | 7.94 | −1.57 (1342) |
| MASQ Depression | 1,348 | 8.83 | 6.68 | 12.00 | 60.00 | 1,003 | 18.73 | 6.78 | 345 | 19.10 | 6.36 | −0.90 (1346) |
| MASQ Anxiety | 1,347 | 6.90 | 4.87 | 11.00 | 42.00 | 1,002 | 16.77 | 4.91 | 345 | 17.28 | 4.73 | −1.67 (1345) |
| Satisfaction w/ Life | 1,345 | 4.80 | 1.30 | 1.00 | 7.00 | 1,000 | 4.84 | 1.28 | 345 | 4.70 | 1.34 | 1.69 (1343) |
| Psychological Well-being | 2,715 | 38.38 | 5.95 | 11.83 | 49.00 | 1,937 | 38.70 | 5.81 | 778 | 37.58 | 6.21 | 4.34 (1353.9)*** |
| Executive Functioning (z-scored) | 2,669 | 0.00 | 1.00 | −3.34 | 3.20 | 1,911 | −0.07 | 0.97 | 758 | 0.18 | 1.04 | −5.84 (1313.9)*** |
| Episodic Memory (z-scored) | 2,666 | 0.00 | 1.00 | −3.19 | 3.95 | 1,909 | −0.11 | 0.99 | 757 | 0.27 | 0.98 | −9.04 (2664)*** |
| Avg Num Physical Symptoms | 2,788 | 1.91 | 1.96 | 0.00 | 16 | 2,009 | 1.90 | 1.93 | 779 | 1.91 | 2.04 | −0.10 (1344.1) |
| Num Chronic Conditions | 2,706 | 2.47 | 2.52 | 0.00 | 20.00 | 1,942 | 2.54 | 2.48 | 764 | 2.31 | 2.62 | 2.15 (2704)* |
| Limitations to ADLs | 2,707 | 1.32 | 0.65 | 1.00 | 4.00 | 1,934 | 1.33 | 0.65 | 773 | 1.29 | 0.64 | 1.52 (2705) |
| Limitations to Instrumental ADLs | 2,707 | 1.77 | 0.88 | 1.00 | 4.00 | 1,934 | 1.81 | 0.89 | 773 | 1.67 | 0.85 | 3.69 (2705)*** |
Note: MIDUS Ref = MIDUS Refresher; ADLs = Activities of Daily Living.
p < .05
p < .01
p < .001
Demographics.
Age, gender, and education were all recorded during the survey portion of MIDUS. Education was measured on a scale of 1 ‘no school/some grade school’ to 12 ‘PH.D., ED.D., MD, DDS, LLB, LLD, JD, or other professional degree’.
Average positive and negative emodiversity.
During the daily diary portion of MIDUS, participants were contacted once each day for 8 days to report on the frequency of emotions experienced that day. The emotion items were selected using a combination of the Positive and Negative Affect Schedule (Watson, Clark, & Tellegen, 1988) and the Non-Specific Psychological Distress Scale (Kessler et al., 2002). On a scale of 0 ‘none of the time’ to 4 ‘all of the time’ participants rated their experience of 13 positive emotions (including feeling cheerful, in good spirits, extremely happy, calm and peaceful, satisfied, full of life, enthusiastic, attentive, proud, active, close to others, like you belong, and confident) and 14 negative emotions (including feeling worthless, so sad nothing could cheer you up, nervous, restless or fidgety, hopeless, that everything was an effort, afraid, jittery, irritable, ashamed, upset, lonely, angry, and frustrated).
As in previous research we used an adapted version of Shannon’s entropy to calculate the diversity of emotional experiences (Quoidbach et al., 2014; Quoidbach et al., 2018). Shannon’s entropy characterizes both the richness and evenness of members of a species in a particular environment, whereas other commonly used indices, such as Gini coefficient, emphasize either richness or evenness (Benson et al., 2018; Magurran, 2004). Although there are drawbacks to using Shannon’s entropy to characterize emodiversity (see Brown & Coyne, 2017, for a critique), we decided to use this metric to allow for easier comparison across studies in the literature and because it characterizes both the richness and evenness aspects of diversity. The formula for calculating emodiversity is below:
In this calculation, Pi represents the proportion of a single emotion item (on a 0-4 frequency scale) over the sum of the frequency of all emotions in the scale. Pi is then multiplied by its natural log. This process is repeated with each emotion item in the scale (through item j), and the resulting values are summed together and multiplied by −1 for an overall emodiversity score. Positive emodiversity scores can range from 0 to 2.56 (given only 13 items) and negative emodiversity scores can range from 0 to 2.64 (given 14 items), where higher scores indicate greater emodiversity. We computed the intra-class correlation (ICC) of each emodiversity score across the week by extracting the random effects from the unconditional means models in R. For positive emodiversity, 62% of the variance in scores across the 8 days was attributable to between-person variation (38% within), and for negative emodiversity 46% of variance was due to between-person variation (54% within).
Mean positive and negative emotion.
Emotion items were averaged each day (within valence) and then averaged across the week to yield overall mean positive and mean negative emotion experienced during the 8-day period. Reliability of the two scales were estimated using the multilevel.reliability function in the “psych” package in R (Revelle, 2019). Reliability of between-person differences when averaged over all emotion items across all days was RkF = .99 for positive emotion and RkF = .98 for negative emotion. The reliability of within-person change in positive emotion over time was RC = .85 and for negative emotion was RC = .77. When examining the ICCs of average positive and negative emotion each day across the study period, 76% of variance in positive emotion and 55% of variance in negative emotion was attributable to between-person variation (24% and 45% attributable to within-person variation, respectively).
Mental health.
Depression.
Depressive symptoms were assessed using two well-validated scales, the Center for Epidemiological Studies-Depression inventory (CESD; Radloff, 1977) and the depression subscale of the Mood and Symptom Questionnaire (MASQ-D; Clark & Watson, 1991). The CESD consists of 20 items summed together, four of which are reverse coded, asking about the frequency of symptoms on a scale of 1 ‘Rarely or none of the time’ to 4 ‘Most or all of the time’ during the past week (α = .90). Items, such as “I thought my life had been a failure” and “I felt that people dislike me” were recoded to a scale of 0 to 4 to mirror the scale in the majority of the literature using the CESD. For the MASQ-D, participants were asked to report how much they had felt or experienced each of 12 items such as “felt depressed” and “felt like a failure” on a scale of 1 ‘Not at all’ to 5 ‘Extremely’ during the past week (α = .90). Items were summed together to create the overall MASQ-D score.
Anxiety.
The anxiety subscale of the MASQ (MASQ-A; Clark & Watson, 1991) was used to assess 11 symptoms of anxiety in the same reporting format and response scale as the MASQ-D. Items such as “felt nervous” and “was unable to relax” were summed together (α = .81).
Psychological well-being.
Well-being research is typically broken down into two components: hedonic and eudaimonic well-being (Ryan & Deci, 2001).
Hedonic well-being.
Hedonic well-being is also thought of as subjective well-being and typically characterized as the subjective state of ‘happiness’ and is comprised of satisfaction with life (including satisfaction with life domains such as work and family), the presence of positive affect, and absence of negative affect (Diener, Suh, Lucas, & Smith, 1999). Given the focus on positive and negative affect as independent variables, the present study used the Satisfaction With Life scale (Pavot & Diener, 1993) as an indicator of hedonic well-being. This scale is comprised of 5 items measured from 1 ‘strongly disagree’ to 7 ‘strongly agree’ and includes items such as “I am satisfied with my life” (α = .88) which are averaged together. Higher scores are indicative of higher levels of hedonic well-being.
Eudaimonic well-being.
Eudaimonic well-being describes a deeper and more profound state of well-being that is indicative of meaning in life, growth, and flourishing. Eudaimonic well-being is comprised of six dimensions: self-acceptance, positive relations with others, autonomy, environmental mastery, purpose in life, and personal growth (Ryff, 1989). These six dimensions are measured with 7 questions each (e.g., “I am quite good at managing the many responsibilities of my daily life” and “I have a sense of direction and purpose in life”) on a scale of 1 ‘strongly agree’ to 7 ‘strongly disagree’, which are averaged together after reverse-coding relevant items, where higher scores indicate higher eudaimonic well-being (subscale α: .70 to .85; complete well-being scale α: .89).
Cognitive functioning.
Executive functioning.
Overall executive functioning was measured using the Brief Test of Adult Cognition by Telephone (BTACT; Lachman, Agrigoroaei, Tun, & Weaver, 2014; Lachman & Tun, 2008) during the cognitive project of MIDUS. The mean of five BTACT sub-tasks assessing working memory, executive function, semantic memory, inductive reasoning, processing speed, reaction time, attention, task switching, and inhibitory control were z-scored and averaged across the full sample to create a composite measure of executive functioning. The tasks included the Backward Digit Span, Category Verbal Fluency, Number Series, Backwards Counting, and the Stop and Go Switch Task (SGST). In MR, the latency of the SGST values differed depending on the phone type of the respondent, thus we used the z-scored composite measure that corrected for the latency difference in phone type. The executive functioning composite was then z-scored to equate the mean to 0 and the standard deviation 1 as in past research using these measures (Lachman et al., 2014; Lachman & Tun, 2008).
Episodic memory.
Another portion of the BTACT measured episodic verbal memory. A list of 15 words was read over the phone to the participant. After the list was recited, participants were given 1.5 minutes to recall as many of the words as possible (immediate recall). At the end of the phone call, participants were again asked to recall as many of the words as possible over 1 minute (delayed recall). The total number of correct, unique responses was recorded for the immediate and delayed recall measures, which were then z-scored and averaged together across the full sample. The episodic memory score was then z-scored again such that the mean was 0 and the standard deviation was 1.
Physical health.
Physical symptoms.
During the daily diary project, participants reported each day whether they experienced any of 28 physical symptoms, such as headache, joint pain, and dizziness. The total number of symptoms experienced each day were summed for each day. An average physical symptoms score was calculated for the diary study period, where higher scores on physical symptoms indicates a participant experienced more physical symptoms, on average, during the week.
Chronic conditions.
Participants in M2 reported how many chronic conditions they experienced in the past 12 months by responding to a checklist of 30 items (e.g., asthma, high blood pressure, ulcer). In MR, the chronic conditions checklist included these same 30 items and nine additional items. The total number of chronic conditions, out of the 30 overlapping items, was totaled for each participant. A higher score indicates having more chronic conditions in the past year.
IADLs and ADLs.
Limitations to Instrumental and Basic and Activities of Daily Living (IADLs and ADLs) were assessed using questions from the Medical Outcomes Study Short Form-36 survey (MOS SF-36; Ware & Sherbourne, 1992). Participants answered question about how much their health limits their ability to perform 3 instrumental activities (e.g., bathe or dress themselves) and 7 basic activities (e.g., walk several blocks). Limitations to IADLs are more severe in nature than limitations to ADLs. Items are rated on a scale of 1 ‘A lot’ to 4 ‘Not at all’, reverse-coded, and averaged within measure (IADL or ADL) such that higher scores reflect greater difficulty in performing activities of daily life. For the sake of analysis, both variables were dichotomized such that a ‘0’ indicated having no limitations, and a ‘1’ indicated having at least some limitation.
Analytic Procedure
A series of 11 hierarchical linear regressions and logistic regressions were conducted to investigate the relationship between emodiversity and four domains of health and well-being: mental distress, psychological well-being, cognitive functioning, and physical health. Continuous dependent variables that were significantly skewed were log transformed if the residual analyses of their regression models indicated non-normality, which was visually assessed using QQ-plots. Log transformations alleviated issues with skew as well as heteroscedasticity. None of the models were found to include outliers using Cook’s d > .5. Multicollinearity was tested using the vif.lm function in R (HH-package 3.1-35, Heiberger, 2018) and although there was some collinearity between the average affect and emodiversity variables, VIF values were below 5 in all models. For linear regression models a Breusch-Pagan test for heteroscedasticity was conducted using the function bptest (lmtest package; Zeileis & Hothorn, 2002). In cases of significant heteroscedasticity, we estimated corrected standard errors for the model using the Heteroscedasticity-Consistent Covariance Matrix Estimate via vcovHC (sandwich package; Zeileis, 2004; Zeileis, 2006). In cases where heteroscedasticity was detected, the models with and without the heteroscedasticity consistent covariance estimate yielded similar p-values.
Each outcome variable was regressed on demographics and covariates (step 1), mean positive and mean negative affect as further covariates (step 2), and average positive emodiversity and average negative emodiversity (step 3). We also included two variables in model 3 to adjust for the total number of days that the participant had positive and negative emodiversity data, which ranged from 1 day to 8 days (positive emodiversity M = 7.30, SD = 1.40; negative emodiversity M = 7.42, SD = 1.28).
Demographics included age, gender (where “male” was used as the reference group), and education. Time between the daily diary and the outcome measure of interest (months between measures) and sample (with M2 serving as the reference group) were considered covariates. Emodiversity variables were entered in the third step of each model to examine the unique contribution of emodiversity above and beyond demographics, covariates, and mean positive and negative affect. To test whether adding emodiversity to the model significantly improved explanatory value, an F-test comparing the R2 values of the two steps was used in the case of linear regression and a Chi2 test of the differences in deviances was used for logistic models. In both cases the anova() function in R was used. Steps where R2 explained does not improve significantly indicates that the addition of the variables in that step does not enhance the explanatory validity of the model. As our primary analyses included 11 regression models, we compared the p-value associated with change in variance explained between steps 2 and 3 (the main contrast of interest in each model) to a Bonferroni corrected threshold (.05/11 = .0045). Steps that do not survive this correction are noted when necessary. Tables of the data were generated using the stargazer library (Hlavac, 2018) and plots of the fitted models were made using the effect_plot function from the jtools library (Long, 2019) and ggplot2 (Wickham, 2016). The data points shown in the plots represent the raw data, but the regression lines reflect the fully adjusted models for the mean values of the other covariates in the model. Descriptives of and intercorrelations between independent variables and covariates are provided in Table 2. R code and supplementary materials are available at https://osf.io/xhnfv/.
Table 2.
Descriptive statistics and intercorrelations between independent variables
| Statistic | Mean | SD | Min | Max | 1. | 2. | 3. | 4. | 5. | 6. | 7. | 8. |
|---|---|---|---|---|---|---|---|---|---|---|---|---|
| 1. Age | 53.86 | 12.88 | 25 | 84 | 1 | |||||||
| 2. Education | 7.47 | 2.52 | 1.00 | 12.00 | −0.14*** | 1 | ||||||
| 3. Average PA | 2.66 | 0.73 | 0.04 | 4.00 | 0.23*** | −0.06** | 1 | |||||
| 4. Average NA | 0.21 | 0.28 | 0.00 | 2.86 | −0.15*** | −0.04* | −0.5*** | 1 | ||||
| 5. Pos emodiversity days | 7.26 | 1.44 | 1.00 | 8.00 | 0.06** | 0.07*** | 0.08*** | −0.21*** | 1 | |||
| 6. Neg emodiversity days | 7.36 | 1.36 | 1.00 | 8.00 | 0.13*** | 0.06*** | 0.1*** | −0.24*** | 0.92*** | 1 | ||
| 7. Pos emodiversity | 2.45 | 0.20 | 0.00 | 2.56 | 0.1*** | 0.02 | 0.69*** | −0.49*** | 0.06*** | 0.05** | 1 | |
| 8. Neg emodiversity | 0.54 | 0.53 | 0.00 | 2.58 | −0.21*** | 0.04 | −0.57*** | 0.86*** | −0.11*** | −0.14*** | −0.4*** | 1 |
Note: N = 2788
p < .05
p < .01
p < .001
Results
Mental Health
After adjusting for demographics and covariates, higher average positive affect (PA) was related to better, and higher mean negative affect (NA) was related to worse, indices of mental health (using all three measures: CESD, MASQ-D, and MASQ-A). When emodiversity was entered in the third step, most of these relationships became non-significant except between average PA in the CESD model and average PA in the MASQ-D model. The model fit improved significantly when including positive and negative emodiversity, as seen in the significant F-values for R2-change between models (see Table 3 for full results and Figure 1 for a graphical depiction of the MASQ-D model; see supplementary materials for the full results of CESD, and MASQ-A).
Table 3.
Hierarchical linear regression model of MASQ-D (log transformed) on covariates, mean affect, and emodiversity
| Step 1 b(SE) | Step 2 b(SE) | Step 3 b(SE) | |
|---|---|---|---|
| Constant | 1.37 (0.02)*** | 1.40 (0.02)*** | 1.50 (0.06)*** |
| Age | −0.002 (0.0003)*** | −0.001 (0.0003)** | −0.001 (0.0003)** |
| Gender (male = reference) | 0.02 (0.01)** | 0.01 (0.01)* | 0.01 (0.01)* |
| Education | −0.003 (0.001) | −0.002 (0.001) | −0.003 (0.001)* |
| Months between measures | 0.00 (0.0002) | −0.0002 (0.0002) | −0.0001 (0.0002) |
| Study (M2 = reference) | −0.002 (0.01) | −0.01 (0.01) | −0.01 (0.01) |
| Avg. PA | −0.05 (0.01)*** | −0.02 (0.01)*** | |
| Avg. NA | 0.15 (0.02)*** | 0.02 (0.03) | |
| Num. positive emodiversity days | −0.001 (0.01) | ||
| Num. negative emodiversity days | 0.003 (0.01) | ||
| Positive emodiversity | −0.08 (0.02)** | ||
| Negative emodiversity | 0.09 (0.01)*** | ||
| R2 | 0.04 | 0.31 | 0.34 |
| Residual Std. Error | 0.13 | 0.11 | 0.11 |
| F | 12.44*** | 84.70*** | 62.21*** |
| Fchange | 253.63*** | 16.16*** |
Note: N = 1348; standard errors and p-values for all regressors obtained using heteroscedasticity consistent estimators.
p < .05
p < .01
p < .001
Figure 1.
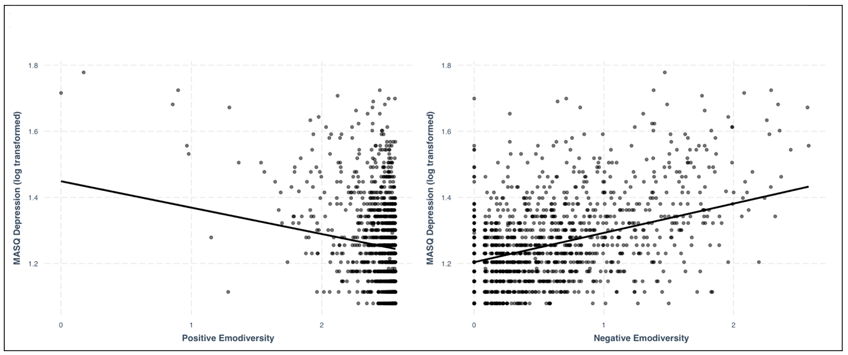
Scatter plot of emodiversity and log-transformed MASQ-Depression scores.
After adjusting for demographics, covariates, and average levels of emotion throughout the week, positive emodiversity was related to lower MASQ depression and anxiety scores, but was not related to CESD scores, providing partial support for hypothesis 1a. Contrary to some previous research and hypothesis 1b, negative emodiversity was related to more symptoms of depression and anxiety on all measures.
Psychological Well-Being
Higher average PA was related to higher psychological well-being and satisfaction with life. Lower average NA was related to worse psychological well-being and satisfaction with life, but the relationship with satisfaction with life became non-significant when accounting for emodiversity. Adding emodiversity to the models improved the model only for satisfaction with life (although the level of significance did not meet the stricter Bonferroni corrected threshold of p = .0045), where more positive emodiversity and less negative emodiversity were related to higher satisfaction with life (see Table 4 and Figure 2 for full satisfaction with life results; see Supplementary materials for full Psychological Well-Being results). Therefore, results were only partially consistent with hypothesis 2a in terms of the positive relationship between positive emodiversity and hedonic (but not eudaimonic) well-being, and contradictory to hypothesis 2b regarding negative emodiversity and psychological well-being.
Table 4.
Hierarchical linear regression model of Satisfaction with Life on covariates, mean affect, and emodiversity
| Step 1 b(SE) | Step 2 b(SE) | Step 3 b(SE) | |
|---|---|---|---|
| Constant | 3.63 (0.21)*** | 2.37 (0.24)*** | 0.97 (0.63) |
| Age | 0.01 (0.003)*** | −0.0002 (0.003) | −0.0001 (0.003) |
| Gender (male = reference) | 0.03 (0.07) | 0.06 (0.06) | 0.07 (0.06) |
| Education | 0.08 (0.01)*** | 0.08 (0.01)*** | 0.08 (0.01)*** |
| Months between measures | −0.004 (0.002)* | −0.003 (0.002) | −0.003 (0.002) |
| Study (M2 = reference) | −0.17 (0.09) | −0.07 (0.08) | −0.07 (0.08) |
| Avg. PA | 0.70 (0.05)*** | 0.54 (0.07)*** | |
| Avg. NA | −0.35 (0.15)* | 0.19 (0.28) | |
| Num. positive emodiversity days | −0.03 (0.06) | ||
| Num. negative emodiversity days | 0.04 (0.07) | ||
| Positive emodiversity | 0.74 (0.26)** | ||
| Negative emodiversity | −0.30 (0.13)* | ||
| R2 | 0.04 | 0.21 | 0.22 |
| Residual Std. Error | 1.28 | 1.16 | 1.15 |
| F | 10.05*** | 51.11*** | 33.90*** |
| Fchange | 148.21*** | 3.19*a |
Note: N = 1345; standard errors and p-values for regressors in steps 2 and 3 obtained using heteroscedasticity consistent estimators.
The level of significance for change in R2 from Step 2 to Step 3, p = 01, does not survive Bonferroni correction at .05/11
p < .05
p < .01
p < .001
Figure 2.
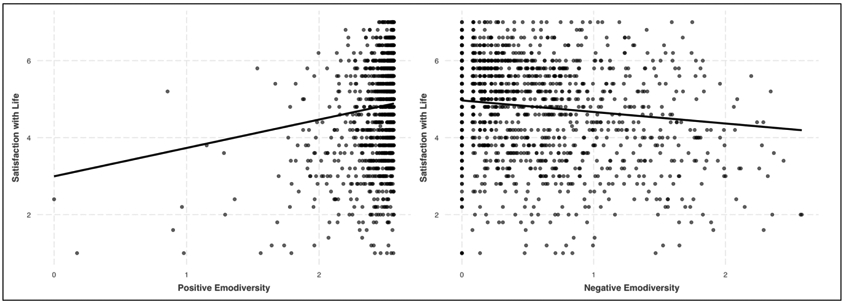
Scatter plot of emodiversity and satisfaction with life.
Cognitive Functioning
Positive affect was not related to either executive functioning or episodic memory in any step of the models, nor was positive emodiversity. Higher average levels of NA were related to worse executive functioning and worse episodic memory, although the relationship between average NA and episodic memory became non-significant when adding emodiversity variables (see supplementary materials for full episodic memory results). Adding emodiversity variables to the model enhanced variance explained in the executive functioning model, but not the episodic memory model, where greater negative emodiversity was related to better executive functioning4 (see Table 5 and Figure 3). In this case, the hypothesis regarding positive emodiversity and cognitive functioning was not supported (hypothesis 3a), but the hypothesis linking negative emodiversity to better cognitive functioning was partially supported (hypothesis 3b).
Table 5.
Hierarchical linear regression model of BTACT Executive Functioning on covariates, mean affect, and emodiversity
| Step 1 b(SE) | Step 2 b(SE) | Step 3 b(SE) | |
|---|---|---|---|
| Constant | 0.65 (0.10)*** | 0.89 (0.13)*** | 0.24 (0.31) |
| Age | −0.03 (0.001)*** | −0.03 (0.001)*** | −0.03 (0.001)*** |
| Gender (male = reference) | −0.20 (0.03)*** | −0.19 (0.03)*** | −0.19 (0.03)*** |
| Education | 0.15 (0.01)*** | 0.14 (0.01)*** | 0.14 (0.01)*** |
| Months between measures | −0.003 (0.001) | −0.002 (0.001) | −0.002 (0.001) |
| Study (M2 = reference) | −0.12 (0.04)** | −0.12 (0.04)** | −0.13 (0.04)** |
| Avg. PA | −0.05 (0.03) | −0.03 (0.04) | |
| Avg. NA | −0.36 (0.08)*** | −0.67 (0.14)*** | |
| Num. positive emodiversity days | −0.01 (0.03) | ||
| Num. negative emodiversity days | 0.05 (0.03) | ||
| Positive emodiversity | 0.10 (0.13) | ||
| Negative emodiversity | 0.25 (0.07)*** | ||
| R2 | 0.32 | 0.33 | 0.34 |
| Residual Std. Error | 0.82 | 0.82 | 0.81 |
| F | 254.53*** | 187.62*** | 124.02*** |
| Fchange | 14.09*** | 8.85*** |
Note: N = 2669; the dependent variable reflects an overall executive functioning composite score using five sub-tasks from the Brief Test of Adult Cognition by Telephone. Means of each sub-task were z-scored and averaged across the full sample. The average was then z-scored again to equate the mean to 0 and the standard deviation to 1 as in previous research. Standard errors and p-values for regressors in steps 2 and 3 obtained using heteroscedasticity consistent estimators.
p < .05
p < .01
p < .001
Figure 3.
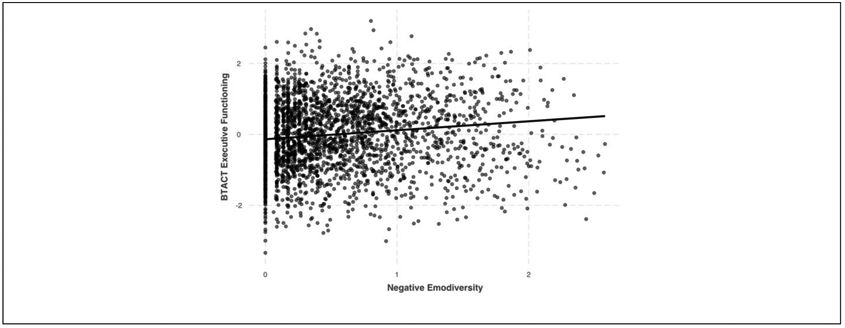
Scatter plot of negative emodiversity and z-scored BTACT executive functioning.
Physical Health
Higher average levels of PA were related to better, and higher average levels of NA were related to worse health on all four indices while adjusting for demographics and covariates, although adding emodiversity variables in step 3 resulted in the relationship between average NA and IADLs becoming non-significant. Adding emodiversity into the models only significantly added to model fit for daily diary physical symptoms and chronic conditions. For the chronic conditions model, however, the change in variance explained from step 2 to step 3 did not fall below the Bonferroni corrected threshold. Greater positive emodiversity (consistent with hypothesis 4a), and lower negative emodiversity (inconsistent with hypothesis 4b), were related to fewer physical symptoms and fewer chronic conditions. Emodiversity was not related to limitations to ADLs or IADLs, in contrast to hypotheses. See Table 6 for full results of the daily diary physical symptoms model (see supplementary materials for tables depicting the remaining physical health regression models).
Table 6.
Hierarchical linear regression model of physical symptoms (log transformed) on covariates, mean affect, and emodiversity
| Step 1 b(SE) | Step 2 b(SE) | Step 3 b(SE) | |
|---|---|---|---|
| Constant | 0.40 (0.03)*** | 0.39 (0.03)*** | 0.49 (0.08)*** |
| Age | 0.001 (0.0004) | 0.002 (0.0003)*** | 0.003 (0.0003)*** |
| Gender (male = reference) | 0.09 (0.01)*** | 0.08 (0.01)*** | 0.07 (0.01)*** |
| Education | −0.01 (0.002)*** | −0.01 (0.002)*** | −0.01 (0.002)*** |
| Study (M2 = reference) | 0.01 (0.01) | 0.005 (0.01) | 0.003 (0.01) |
| Avg. PA | −0.07 (0.01)*** | −0.03 (0.01)*** | |
| Avg. NA | 0.33 (0.02)*** | 0.10 (0.04)** | |
| Num. positive emodiversity days | −0.01 (0.01) | ||
| Num. negative emodiversity days | 0.005 (0.01) | ||
| Positive emodiversity | −0.08 (0.03)* | ||
| Negative emodiversity | 0.15 (0.02)*** | ||
| R2 | 0.05 | 0.29 | 0.31 |
| Residual Std. Error | 0.24 | 0.21 | 0.21 |
| F | 38.64*** | 186.08*** | 123.84*** |
| Fchange | 455.71*** | 22.04*** |
Note: N = 2788; the dependent variable reflects the average number of physical health symptoms experienced during each day of the daily diary project, log transformed for normality. Standard errors and p-values for all regressors obtained using heteroscedasticity consistent estimators.
p < .05
p < .01
p < .001
Discussion
Past research has suggested that having more diverse emotional experiences, both positive and negative, is related to better mental and physical health (e.g., Quoidbach et al., 2014). The present research tested the relationship between emodiversity and a number of health and well-being outcomes in a large daily diary sample while also adjusting for mean levels of positive and negative affect. The repeated measures of the daily diary sample allowed for a more reliable estimation of each individual’s typical emodiversity in daily life compared to measures taken at a single timepoint. Similar to past research, we found that emodiversity was related to a variety of health and well-being measures even after adjusting for mean levels of emotion, demonstrating the utility of measuring the diversity of one’s emotional experiences in addition to average levels of positive and negative affect. Positive emodiversity was related to a number of beneficial outcomes: having, on average, more diverse positive emotions over the span of 8 days was related to fewer symptoms of depression and anxiety using the MASQ scales, greater satisfaction with life, and fewer physical health symptoms and chronic conditions. Contrary to past research and our hypotheses, negative emodiversity was generally related to worse outcomes: more negative emodiversity was related to more symptoms of anxiety and depression, worse satisfaction with life, and more daily physical health symptoms and chronic conditions. Only executive functioning showed a positive relationship with negative emodiversity.
Previous emodiversity research has also utilized global emodiversity metrics which account for the diversity of emotions experienced regardless of valence. This has often been done in addition to examining positive and negative emodiversity in separate models. Due to our interest in comparing the relationship between emodiversity and aspects of health and well-being as a function of valence we opted not to use a global emodiversity score and to instead examine positive and negative emodiversity as separate variables. Had we only examined global emodiversity, however, the specificity of our results would have been lost given that positive and negative emodiversity show opposing relationships with many of the outcomes of interest. As can be seen in the supplementary materials, modeling emodiversity globally either entirely obscures the relationship between emodiversity and outcome measures, or biases findings in the direction of negative emodiversity. Because of this, we recommend that future emodiversity research continues to examine positive and negative emodiversity as separate variables.
Positive Emodiversity
Literature on emodiversity has attempted to explain the relationship between emodiversity and mental and physical health by pointing to the potential benefits of having a more diverse emotional life. Having a more diverse emotional life provides more detailed information about the surrounding environment thus allowing an individual to respond and adapt in a more specific manner to the situation at hand (Kashdan, Barrett, & McKnight, 2015; Quoidbach et al., 2014). Although our findings paint a less adaptive picture of negative emodiversity, we still believe this explanation holds for why positive emodiversity is related to more adaptive outcomes.
Any explanation for why emodiversity is “beneficial,” however, should be read with caution as the existing research on emodiversity and health and well-being measures is purely correlational in nature. Being more psychologically and physically healthy may allow a person to experience a more diverse range of positive emotions due to having fewer limitations on cognitive and physical resources. Thus, further work is needed to better understand the direction of the relationship between positive emodiversity and healthier outcomes, as well as the mechanism behind this relationship. Future research should attempt to manipulate the diversity of emotions experienced in an experimental paradigm as well as examine the longitudinal relationship between emodiversity and well-being outcomes. Data collection for a third wave of MIDUS (M3) is currently underway and will allow such longitudinal comparisons.5
Despite finding that positive emodiversity was related to a number of more adaptive outcomes, it is important to note the lack of a relationship between positive emodiversity and a number of our outcome measures. Psychological well-being, both measures of cognitive functioning, and the measures of limitations to daily living held no significant relationship with positive emodiversity. These findings tell us that positive emodiversity might play a more important role with certain aspects of health and well-being (e.g., mental health and self-reported health symptoms) than others (e.g., cognitive functioning, day-to-day physical functioning). Furthermore, positive emodiversity was not related to CESD depression, despite being related to fewer symptoms of depression using the MASQ-D. The inconsistencies between scales intended to measure the same construct, and between scales that are meant to measure different granular aspects of similar types of functioning, imply that the relationship between emodiversity and well-being is complex and results should be replicated using a variety of more clinically significant measures.
Negative Emodiversity
Unexpectedly, negative emodiversity was related to mostly maladaptive outcomes. Negative emodiversity had an adaptive relationship with executive functioning only, despite our expectation that greater negative emodiversity would be related to better outcomes all around. One reason for the inconsistency between our results and past research might be due to the nature of a single survey measurement utilized in previous reports compared to the multiple daily diary measurements in this study. Perhaps reporting more negative emodiversity at a single time point is indeed related to better outcomes in the same way positive emodiversity is but experiencing more diverse negative emotions over an extended period of time might be more indicative of maladaptive functioning. Another potential explanation for inconsistency is that our sample was comprised of adults from the United States, whereas the initial studies on emodiversity were conducted on European samples. Cultures differ in the valence, intensity, and complexity of emotions they value (Grossmann, Huynh, & Ellsworth, 2016; Tsai, 2007). Complexity could be considered more socially acceptable for some cultures, and thus related to more adaptive outcomes compared to others.
Differences between unique emotion items that compose the overall scales could also have led to differences in results between studies. Our scale included items that tapped into feelings of worthlessness, hopelessness, and loneliness that were not assessed directly in past research (e.g., Quoidbach et al., 2014; Ong et al., 2018). Furthermore, although our emotion items were intended to measure frequency, the wording of some of the items may inadvertently imply intensity. For example, “so sad nothing could cheer you up” may be more intense in nature than “sadness.” One possibility is that experiencing a diverse range of low intensity negative emotions may be associated with beneficial outcomes, but experiencing a diverse range of high intensity negative emotions is inherently toxic and harmful. Follow-up studies comparing emodiversity using emotions of differential dimensionality and intensity is needed.
The idea that negative emodiversity is related to worse health and well-being outcomes is not entirely novel. One group used a momentary sampling method to examine a variety of time-based emotional complexity metrics in relation to different aspects of well-being (Grühn et al., 2013). Included in the metrics was a “component score,” which characterized the total number of emotion components that were needed to account for variation in affective reports over the span of 7 days. The greater the number of components, the more complex (and we would argue, the more diverse) a person’s emotional reports are. They found that greater component scores were related to higher depressive symptoms, trait negative affect, and neuroticism, and lower life satisfaction, autonomy, self-acceptance, conscientiousness, agreeableness, and less complexity in descriptions of the self. This metric was not related to any adaptive outcomes. The component score included both positive and negative affect in the same metric, however, so the unique contribution of positive compared to negative components cannot be ascertained. These findings, along with our own, highlight the need to utilize multiple metrics of complexity in relation to measures of adaptive outcomes to better understand the nature of the relationship between emodiversity and well-being outcomes.
Despite the maladaptive relationship between negative emodiversity and mental health, psychological well-being, and physical health outcomes, negative emodiversity was related to better executive functioning. This finding is consistent with those examining the relationship between emodiversity and wise reasoning, where more positive and negative emodiversity was related to greater wisdom (Grossmann et al., 2019). Having a more diverse range of negative emotions may provide one with more experiences to draw upon when facing life challenges, leading to more mental flexibility and more effective reasoning abilities. On the other hand, it could be the case that higher executive functioning allows for the experience of a broader range of negative emotions. Future research should compare the directionality of the link between emodiversity and executive functioning, as well as other cognitive abilities, especially with varying intensity of negative emotions.
Flexibility vs. Instability
The results presented here highlight the underlying debate of whether emotional complexity should be considered an indicator of “flexibility” or instead as “instability.” When greater complexity is related to beneficial outcomes, we have a tendency to interpret more complex emotional experiences as indicating greater flexibility, where the individual in question is better attuned to their environment and thus better equipped to respond to it. However, when we find greater complexity is related to maladaptive outcomes, our interpretation becomes one of the same individual as unstable, where they have difficulty successfully processing their environment and responding appropriately. As research on various measures of complexity grows, more consideration should be placed on under what conditions emotional complexity is flexible compared to unstable. It is possible, for example, that negative emodiversity is beneficial for people who have the resources (e.g., cognitive, physical, socioeconomic, or otherwise) to actually change the specific cause of the negative emotion being experienced. People who do not have access to those resources, such as those who struggle with mental health issues, might be better off experiencing a more limited range of negative emotions. In addition, the current theoretical and measurement frameworks for studying emodiversity do not take into account the extent to which the experienced emotion is context-appropriate. Contextually-appropriate emodiversity may have very different consequences from contextually-inappropriate emodiversity. Such issues require further theoretical and empirical exploration.
Limitations
Emodiversity is a concept that is borrowed from the natural sciences, which uses diversity indices to assess the richness and evenness of species in a given environment. Although the concept of a diverse emotional ecosystem maps well onto the idea of a diverse biological ecosystem, in practice the calculation of emodiversity is limited as a consequence of borrowing from biodiversity indices. In psychology, measures of positive and negative affect are typically limited in both the scale (0-4) and specific kinds of emotions (in our case we used 13 positive and 14 negative emotions). In the biodiversity literature, the total count of members of species would not be bounded and the total number of species is not necessarily predetermined for each environment (see Brown & Coyne, 2017, for a critique of using biodiversity indices to study emotional diversity). Despite this limitation, emodiversity as it is measured here still provides a reliable metric to examine the relationship between emotional diversity and well-being. Future research could use unbounded, self-generated lists of emotions experienced and could also look at a count of emotions experienced throughout the day using momentary sampling.
Summary & Conclusion
Much research has demonstrated the relationship between a person’s average level of positive and negative affect and a variety of health and well-being outcomes. Building on previous emodiversity literature, the present study demonstrates the utility of measuring the diversity of emotional experiences above and beyond average levels of affect when assessing mental, cognitive, and physical health. As with previous research, having more diverse positive emotional experiences over the course of a week was related to healthier outcomes: fewer symptoms of depression and anxiety and fewer physical symptoms. In contrast with previous literature, however, the present research demonstrated that having more diverse negative emotions was related to poorer outcomes, including more symptoms of depression and anxiety and more physical symptoms. Negative emodiversity was only related to one beneficial outcome higher levels of executive functioning. Future research on emodiversity and other metrics of emotional variability would do well to test the directionality of these relationships as well as assess the circumstances in which emotional variability can be considered flexible vs. unstable.
Supplementary Material
Figure 4.
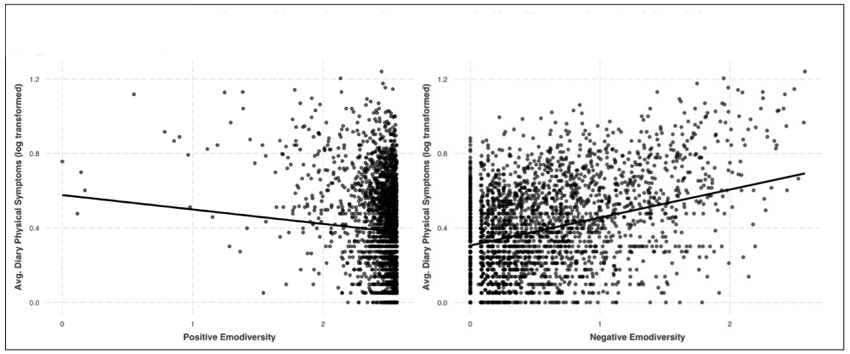
Scatter plot of emodiversity and average daily diary physical health symptoms (log transformed)
Acknowledgments
MIDUS has been supported by The National Institute on Aging (P01-AG020166, U19 AG051426). E.J.U. was supported by the National Institute of Mental Health through T32MH018931. The content is solely the responsibility of the authors and does not necessarily represent the official views of the National Institutes of Health.
Footnotes
An alternative approach is to compute emodiversity across the entire study period, which is highly correlated with the approach that averages across days (r = .84 for positive emodiversity, r = .76 for negative emodiversity). We opted to use the average emodiversity score for two reasons. First, averaging across days provides a more reliable estimate of an individual’s typical emotional diversity. Second, when calculated across the entire week in the present dataset, positive emodiversity scores were highly negatively skewed and had little to no variability, thus making any relationship between positive emodiversity and well-being difficult to detect.
Six additional variables were tested based on recommendations from colleagues during initial reviews of the manuscript. Full results of these models can be found in supplementary materials, but are not included in the main manuscript because they were not included in the original hypotheses.
Regarding cohort differences on independent variables: the MIDUS Refresher cohort was significantly younger, t(2786) = 16.01, p < .001, and had significantly higher levels of education, t(2786) = −7.14, p < .001, than those in MIDUS 2. There were no significant differences between cohorts in the gender distribution X2(1) = 0.63, p = .43. Regarding differences on emotion variables: the MIDUS Refresher cohort had significantly lower average positive affect, t(2786) = 6.35, p < .001, lower positive emodiversity, t(2786) = 2.37, p = .018, and significantly higher negative affect, t(2786) = −2.00, p = .045, and negative emodiversity, t(1335.9) = −4.12, p < .001.
When running the model without average NA, the relationship between negative emodiversity and executive functioning became non-significant (p= .37) and became negative. This indicates the possibility of a suppression effect; however, we believe the models reported in this paper are only theoretically meaningful when including both average affect and emodiversity. The strong positive relationship between negative affect (which has a negative zero-order correlation with executive functioning) and negative emodiversity (which has a positive zero-order correlation with executive functioning) leaves open the possibility that the relationship between negative emodiversity and executive functioning is being driven by average NA when average NA is not included in the model. One concern with having such highly correlated independent variables in the same model is multicollinearity. As stated earlier, tests for multicollinearity revealed non-problematic variance inflation factors (which were all below 5 for this particular model).
The first wave of MIDUS (M1) would be an ideal candidate for a longitudinal examination of emodiversity, however, the diary study at M1 only included one positive emotion item and only 7 of the 11 M1 negative emotion items overlapped with M2 and MR.
References
- Benson L, Ram N, Almeida DM, Zautra AJ, & Ong AD (2017). Fusing Biodiversity Metrics into Investigations of Daily Life: Illustrations and Recommendations With Emodiversity. The Journals of Gerontology: Series B, 73(1), 75–86. 10.1093/geronb/gbx025 [DOI] [PMC free article] [PubMed] [Google Scholar]
- Brown NJL, & Coyne JC (2017). Emodiversity: Robust predictor of outcomes or statistical artifact? Journal of Experimental Psychology: General, 146(9), 1372–1377. 10.1037/xge0000330 [DOI] [PubMed] [Google Scholar]
- Champely S (2018). pwr: Basic functions for power analysis. R package version 1.2-2. https://CRAN.R-project.org/package=pwr [Google Scholar]
- Charles ST, Piazza JR, & Urban EJ (2017). Mixed emotions across adulthood: when, where, and why? Current Opinion in Behavioral Sciences, 15, 58–61. https://doi.Org/10.1016/j.cobeha.2017.05.007 [DOI] [PMC free article] [PubMed] [Google Scholar]
- Clark LA, & Watson D (1991). Tripartite model of anxiety and depression: Psychometric evidence and taxonomic implications. Journal of Abnormal Psychology, 100(3), 316–336. https://doi.Org/10.1037/0021-843X.100.3.316 [DOI] [PubMed] [Google Scholar]
- Davidson RJ, Jackson DC, & Kalin NH (2000). Emotion, plasticity, context, and regulation: perspectives from affective neuroscience. Psychological Bulletin, 126(6), 890–909. https://doi.Org/10.1037/0033-2909.126.6.890 [DOI] [PubMed] [Google Scholar]
- Diener E, Suh EM, Lucas RE, & Smith HL (1999). Subjective well-being: Three decades of progress. Psychological Bulletin, 125(2), 276–302. [Google Scholar]
- Grossmann I, & Ellsworth PC (2017). What are mixed emotions and what conditions foster them? Life-span experiences, culture and social awareness. Current Opinion in Behavioral Sciences, 15, 1–5. https://doi.Org/10.1016/j.cobeha.2017.05.001 [Google Scholar]
- Grossmann I, Huynh AC, & Ellsworth PC (2016). Emotional Complexity: Clarifying definitions and cultural correlates. Journal of Personality and Social Psychology, 111(6), 895–916. doi: 10.1037/pspp0000084 [DOI] [PubMed] [Google Scholar]
- Grossmann I, Oakes H, & Santos HC (2019). Wise reasoning benefits from emodiversity, irrespective of emotional intensity. Journal of Experimental Psychology: General, 148(5), 805. doi: 10.1037/xge0000543 [DOI] [PubMed] [Google Scholar]
- Grühn D, Lumley M, Diehl M, & Labouvie-Vief G (2013). Time-based indicators of emotional complexity: Interrelations and correlates. Emotion, 13(2), 226–237. doi: 10.1037/a0030363.Time-Based [DOI] [PMC free article] [PubMed] [Google Scholar]
- Hlavac M (2018). stargazer: Well-formatted regression and summary statistics tables. R package version 5.2.1. https://CRAN.R-project.org/package=stargazer [Google Scholar]
- Heiberger RM (2018). HH: Statistical Analysis and Data Display. R package version 3.1–35. https://cran.r-project.org/web/packages/HH/index.html [Google Scholar]
- Kahneman D, Diener E, & Schwarz N (Eds.). (1999). Well-being: Foundations of hedonic psychology. Russell Sage Foundation. [Google Scholar]
- Kashdan TB, Barrett LF, & McKnight PE (2015). Unpacking emotion differentiation: Transforming unpleasant experience by perceiving distinctions in negativity. Current Directions in Psychological Science, 24(1), 10–16. doi: 10.1177/0963721414550708 [DOI] [Google Scholar]
- Kessler RC, Andrews G, Colpe LJ, Hiripi E, Mroczek DK, Normand SLT, … Zaslavsky AM, (2002). Short screening scales to monitor population prevalences and trends in non-specific psychological distress. Psychological Medicine, 32(6), 959–976. 10.1017/S0033291702006074 [DOI] [PubMed] [Google Scholar]
- Lachman ME, Agrigoroaei S, Tun PA, & Weaver SL (2014). Monitoring cognitive functioning: Psychometric properties of the Brief Test of Adult Cognition by Telephone. Assessment, 21(4), 404–417. doi: 10.1177/1073191113508807 [DOI] [PMC free article] [PubMed] [Google Scholar]
- Lachman ME, & Tun PA (2008). Cognitive testing in large-scale surveys: Assessment by telephone. In Hofer SM & Alwin DF (Eds.), Handbook of cognitive aging: Interdisciplinary perspectives (pp. 506–523). Thousand Oaks, CA, US: Sage Publications, Inc. doi: 10.4135/9781412976589.n30 [DOI] [Google Scholar]
- Lindquist KA, & Barrett LF (2008). Emotional complexity. Handbook of Emotions, 513 530. [Google Scholar]
- Liu Y, Bangerter LR, Rovine MJ, Zarit SH, & Almeida DM (2016). Intrinsic emotional fluctuation in daily negative affect across adulthood. The Journals of Gerontology Series B: Psychological Sciences and Social Sciences, 73(1), gbw159. doi: 10.1093/geronb/gbw159 [DOI] [PMC free article] [PubMed] [Google Scholar]
- Long JA (2019). jtools: Analysis and presentation of social scientific data. R package version 2.0.1, (URL: https://cran.r-project.org/package=jtools) [Google Scholar]
- Magurran AE (2004). Measuring Biological Diversity. Blackwell Science Ltd. [Google Scholar]
- Ong AD, Benson L, Zautra AJ, & Ram N (2018). Emodiversity and biomarkers of inflammation. Emotion, 18(1), 3–14. doi: 10.1037/emo0000343 [DOI] [PMC free article] [PubMed] [Google Scholar]
- Pavot W & Diener E (1993). Review of the Satisfaction With Life Scale. Psychological Assessment, 5(2), 164–172. doi: 10.1037/1040-3590.5.2.164 [DOI] [Google Scholar]
- Pressman SD, & Cohen S (2005). Does positive affect influence health? Psychological Bulletin, 131(6), 925–971. doi: 10.1037/0033-2909.131.6.925 [DOI] [PubMed] [Google Scholar]
- Quoidbach J, Gruber J, Mikolajczak M, Kogan A, Kotsou I, & Norton MI (2014). Emodiversity and the emotional ecosystem. Journal of Experimental Psychology: General, 143(6), 2057–2066. doi: 10.1037/a0038025 [DOI] [PubMed] [Google Scholar]
- Quoidbach J, Mikolajczak M, Gruber J, Kotsou I, Kogan A, & Norton MI (2018). Robust, replicable, and theoretically-grounded: A response to Brown and Coyne’s (2017) commentary on the relationship between Emodiversity and health. Journal of Experimental Psychology: General, 147(3), 451–458. doi: 10.1037/xge0000400 [DOI] [PubMed] [Google Scholar]
- Radloff LS (1977). The CES-D scale: A self-report depression scale for research in the general population. Appl. Psychol. Meas, 1(3), 385–401. doi: 10.1177/014662167700100306 [DOI] [Google Scholar]
- Revelle W (2019) psych: Procedures for Personality and Psychological Research, Northwestern University, Evanston, Illinois, USA, https://CRAN.R-project.org/package=psychVersion=1.9.12. [Google Scholar]
- Ryan RM, & Deci EL (2001). On happiness and human potentials: a Review of research on hedonic and eudaimonic well-being. Annual Review of Psychology, 52, 141–166. doi: 10.1146/annurev.psych.52.1.141 [DOI] [PubMed] [Google Scholar]
- Ryan RM, Laguardia JG, & Rawsthorne LJ (2005). Self-complexity and the authenticity of self-aspects : Effects on well being and resilience to stressful events. North, 7(3), 431–448. doi: 10.1016/j.celrep.2011.1011.1001.7. [DOI] [Google Scholar]
- Ryff CD (1989). Happiness is everything, or is it? Explorations on the meaning of psychological well-being. Journal of Personality and Social Psychology, 57(6), 1069–1081. doi: 10.1037//0022-3514.57.6.1069 [DOI] [Google Scholar]
- Tsai JL (2007). Ideal affect: Cultural causes and behavioral consequences. Perspectives on Psychological Science, 2(3), 242–259.doi: 10.1111/j.1745-6916.2007.00043.x [DOI] [PubMed] [Google Scholar]
- Ware JE, & Sherbourne CD (1992). The MOS 36-Item Short-Form Health Survey (SF-36): I. Conceptual bramework and item selection. Medical Care, 30(6), 473–483. doi: 10.1097/00005650-199206000-00002 [DOI] [PubMed] [Google Scholar]
- Watson D, Clark LA, & Carey G (1988). Positive and negative affectivity and their relation to anxiety and depressive disorders. Journal of Abnormal Psychology, 97(3), 346–353. doi 10.1037/0021-843X.97.3.346 [DOI] [PubMed] [Google Scholar]
- Watson D, Clark LA, & Tellegen A (1988). Development and validation of brief measures of positive and negative affect: the PANAS scales. Journal of Personality and Social Psychology, 54(6), 1063–1070. [DOI] [PubMed] [Google Scholar]
- Wickham H (2016). ggplot2: elegant graphics for data analysis. Springer. [Google Scholar]
- Wiese CW, Chen ZJ, Tay L, Friedman EM, & Rector JL (2018). The Role of affect on physical health over time : A Cross-lagged panel analysis over 20 years. doi: 10.1111/aphw.12149 [DOI] [PubMed] [Google Scholar]
- Zeileis A & Hothorn T (2002). Diagnostic checking in regression relationships. R News 2(3), 7–10. URL https://CRAN.R-project.org/doc/Rnews/ [Google Scholar]
- Zeileis A (2004). Econometric computing with HC and HAC covariance matrix estimators. Journal of Statistical Software, 11(10), 1–17. doi: 10.18637/jss.v011.i10 (URL: 10.18637/jss.v011.i10) [DOI] [Google Scholar]
- Zeileis A (2006). Object-oriented computation of sandwich estimators. Journal of Statistical Software, 16(9), 1–16. doi: 10.18637/jss.v016.i09 (URL: 10.18637/jss.v016.i09) [DOI] [Google Scholar]
Associated Data
This section collects any data citations, data availability statements, or supplementary materials included in this article.