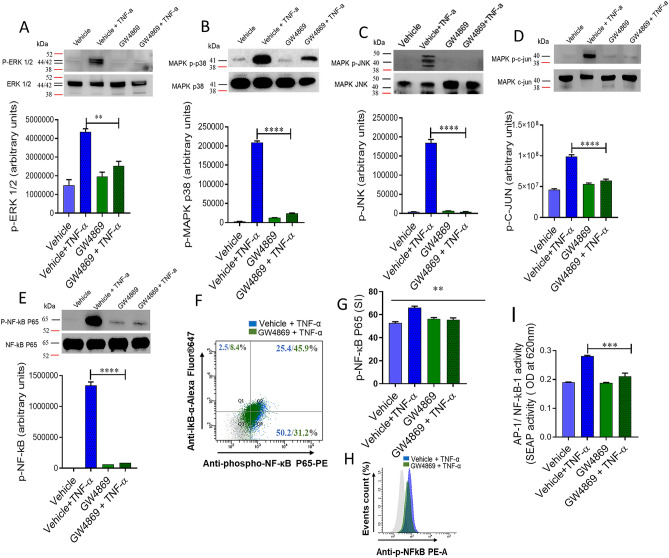
Figure 4.
Inhibition of nSMase affects TNF-α activated MAPK and NF-κB signaling pathways in monocytic cells. Monocytic cells were pretreated with nSMase inhibitor (GW4869: 10 µM) and then incubated with TNF-α for 15 min. Cell lysates were prepared as described in Methods. Samples were run on denaturing gels. Immuno-reactive bands were developed using an Amersham ECL Plus Western Blotting Detection System (GE Healthcare, Chicago, IL, USA) and visualized by Molecular Imager ChemiDoc Imaging Systems (Bio-Rad Laboratories, Hercules, CA, USA). (A) Phosphorylated proteins of ERK1/2 (p42/44), (B) p38 MAPK, (C) JNK, (D) c-Jun and (E) NF-κB are depicted in the upper panels and total respective proteins are shown in the lower panels. Phosphorylation intensity of p38 MAPK, ERK1/2, and NF-κB was quantified using Image Lab software (version 6.0.1, Bio-Rad, Hercules, CA, USA) and are presented in arbitrary units. All data are expressed as mean ± SEM (n ≥ 3). **** P < 0.0001 versus TNF-α without respective inhibitor. NF-κB phosphorylation was also determined by flow cytometry. (F) Representative flow cytometry dot plots of p-NF-κB fluorescence versus total IκBα cells. (G) Flow cytometry data are presented as a bar graph of mean staining index as well as (H) representative histogram. Bar graphs depict mean values ± SEM of staining intensity (SI). P < 0.05 was considered as statistically significant (*P ≤ 0.05; **P ≤ 0.01, ***P ≤ 0.001, ****P ≤ 0.0001). The data in all Figures are representative of three independent experiments. (I) NF-κB reporter monocytic cells were pretreated with nSMase inhibitor (GW4869: 10 µM) or vehicle for 1 h and then incubated with TNF-α for 12 h. Cell culture media were assayed for SEAP reporter activity (degree of NF-κB activation).

