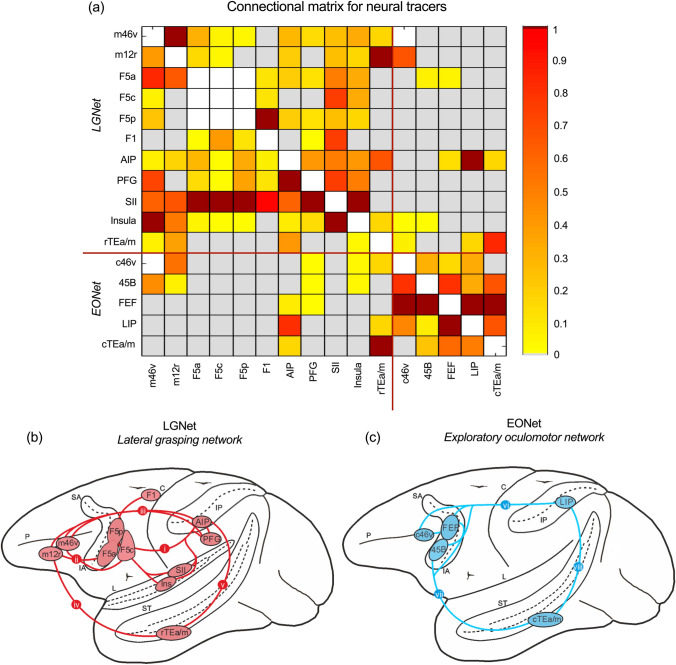
Fig. 1.
a The extent and strength of neural tracer connectivity between different sectors, amalgamated from previous studies (see text). The strength of the connections between areas of the two networks is normalized to the strongest one and indicated in dark red; b the LGNet (Borra and Luppino, 2017) in red and its (i) parieto-frontal, (ii) fronto-prefrontal, (iii) parieto-prefrontal, (iv) temporo-frontal, and (v) parieto-temporal connections; c The EONet in blue and its (vi) parieto-frontal, (vii) temporo-frontal, and (viii) parieto-temporal connections. C central sulcus, IA inferior arcuate sulcus, IP intraparietal sulcus, L lateral fissure, P principal sulcus, SA superior arcuate sulcus, ST superior temporal sulcus

