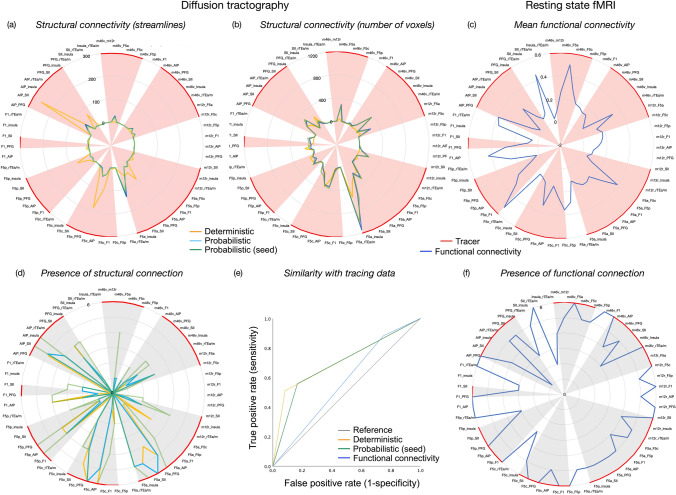
Fig. 2.
Connections of the LGNet shown as radar charts, based on a the average number of streamlines across the six monkeys, b the average number of voxels occupied by these streamlines across the six monkeys c mean functional connectivity, based on the average computed on the individual level, and mean structural connectivity for each measure across six monkeys (converted to standard scores). The consistency of these connections across the six monkeys are shown as radar charts for d structural connectivity and (f) functional connectivity. The shaded region (red, grey) indicates that a connection has been identified using tracing e A ROC curve shows the sensitivity and specificity of each structural and functional imaging technique to identify connections revealed by tracers

