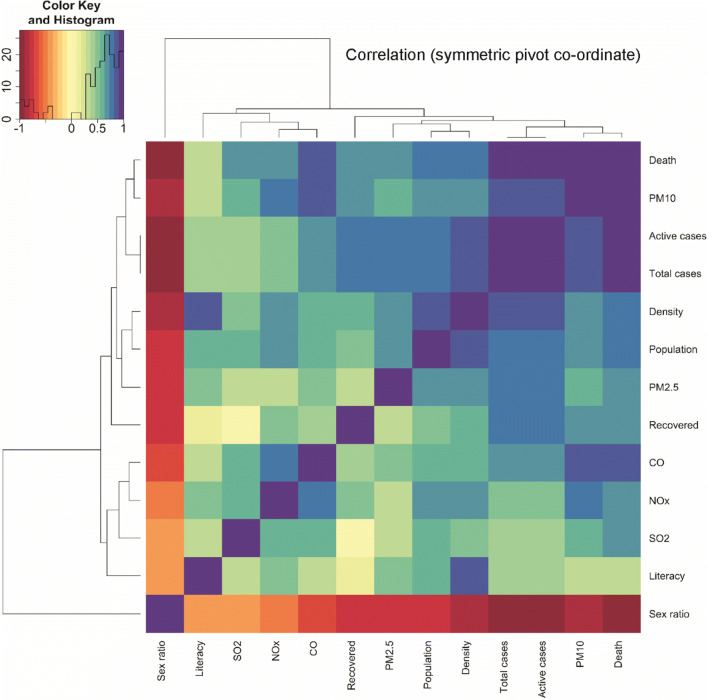
Fig. 7.
Heat-plot showing the relation between different demographic and air quality parameters and COVID-19 incidences in Maharashtra. This is made based on city wise demographic, air quality, and COVID-19 data. For air quality data, maximum average concentration between the three pre-lockdown phases (PL1, PL2, and PL3: Jan to March 2020) was taken. COVID-19 data was taken as on 3 July 2020

