
Figure 4.
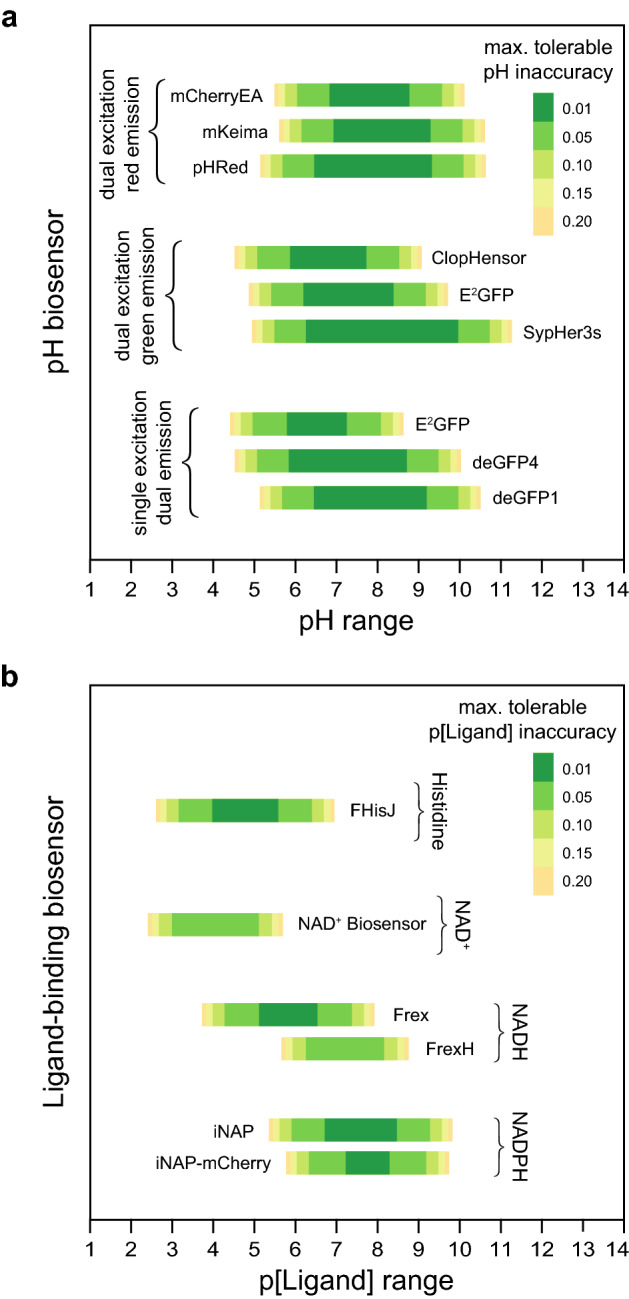
Predicted accuracy of pH and ligand-binding biosensors. Predictions of the ranges of pH (a), and histidine, NAD+, NADH, and NADPH values (b) that we expect to measure accurately in pm3 pharyngeal muscles with existing biosensors given the empirical precision of our R measurements and selecting optimal excitation or emission filters for each biosensor. The E2GFP biosensor can be used in two different modalities, dual-excitation green-fluorescence and single-excitation dual-emission. Differences in the predicted pH inaccuracy of this biosensor under each imaging modality arise from the differences between the values in each imaging modality of this biosensor’s overall dynamic range and dynamic range in the second wavelength (Supplementary Note 8). The colored bars denote the range of values of the biosensor’s biochemical input where we have 95% confidence that an individual observation would deviate from its true value by less than the error denoted by the color of the bar. p[Ligand] is the negative base 10 logarithm of the Molar concentration of the biosensor’s ligand.