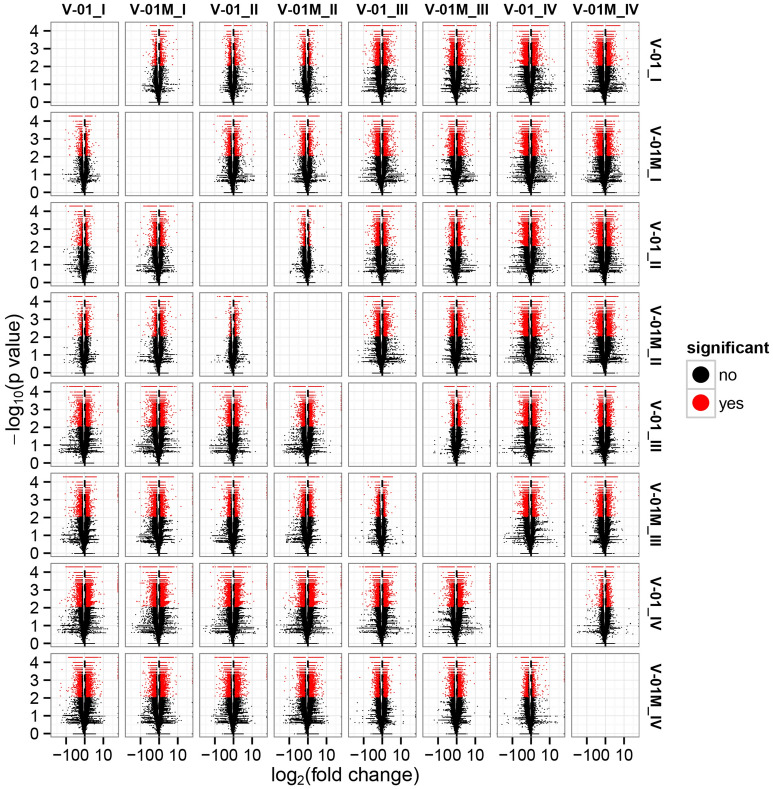
Figure 4.
Volcano map of differentially expressed genes in a comparison of 24 libraries, which were constructed from the flowers of the two lines (‘V-01’ and ‘V-01M’) at the four developmental stages (e.g. V-01_I indicates the flower development stage I of V-01 and so on). The abscissa represents the level of fold change of the differentially expressed genes. The ordinates represents the significance level of the gene expression changes. Significantly differentially expressed genes are shown as red dots, while those with no significant difference are shown as black dots.

