Figure 2.
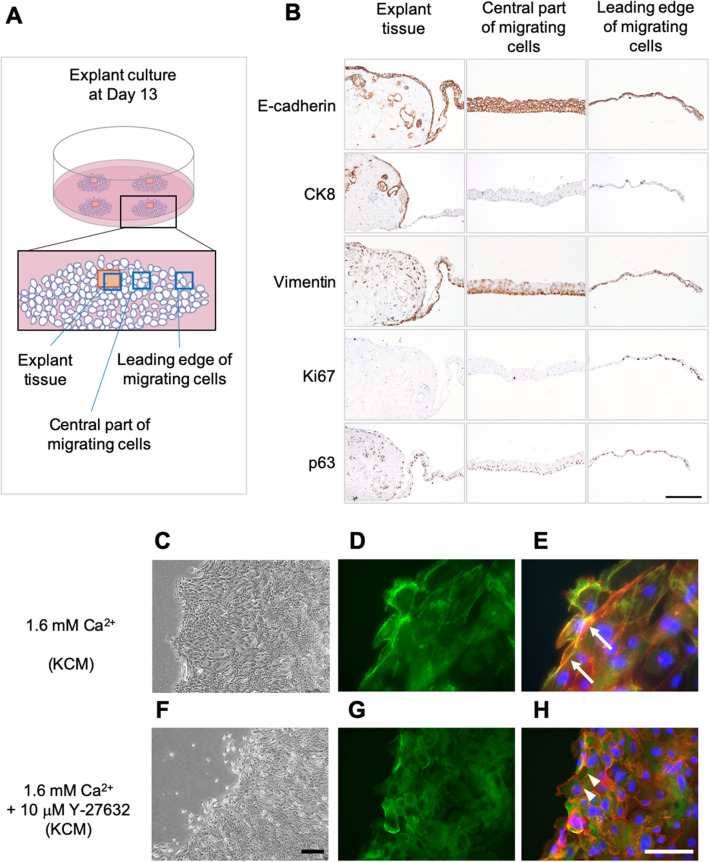
Protein expression during explant culture. (A) Schematic diagram illustrating the positions of the tissues shown in B (explant tissue, central part of the migrating cells and leading edge of the migrating cells). (B) Immunohistological evaluation of the expressions of E-cadherin, CK8, vimentin and Ki67 in the explant tissue (left column), central part of the migrating cells (center column), and leading edge of the migrating cells (right column). (C) Phase-contrast microscopy images of the peripheral region of outgrowing cells cultured in normal KCM containing 1.6 mM Ca2+. (D) Immunohistological detection of P-MLC (green) at day 13 of explant culture in normal KCM containing 1.6 mM Ca2+. (E) Image in C merged with images stained using phalloidin (red) and DAPI (blue). White arrows indicate stress fibers with phosphorylated MLC. (F) Phase-contrast microscopy images of the peripheral region of outgrowing cells cultured in KCM containing 1.6 mM Ca2+ + 10 μM Y-27632. (G) Immunolocalization of P-MLC (green) at day 13 of explant culture in KCM containing 1.6 mM Ca2+ + 10 μM Y-27632. (H) Image in F merged with images stained using phalloidin (red) and DAPI (blue). White arrowheads indicate actin depolymerization. Scale bars = 200 μm (B), 300 μm (C,F) and 100 μm (D,E,G,H).

