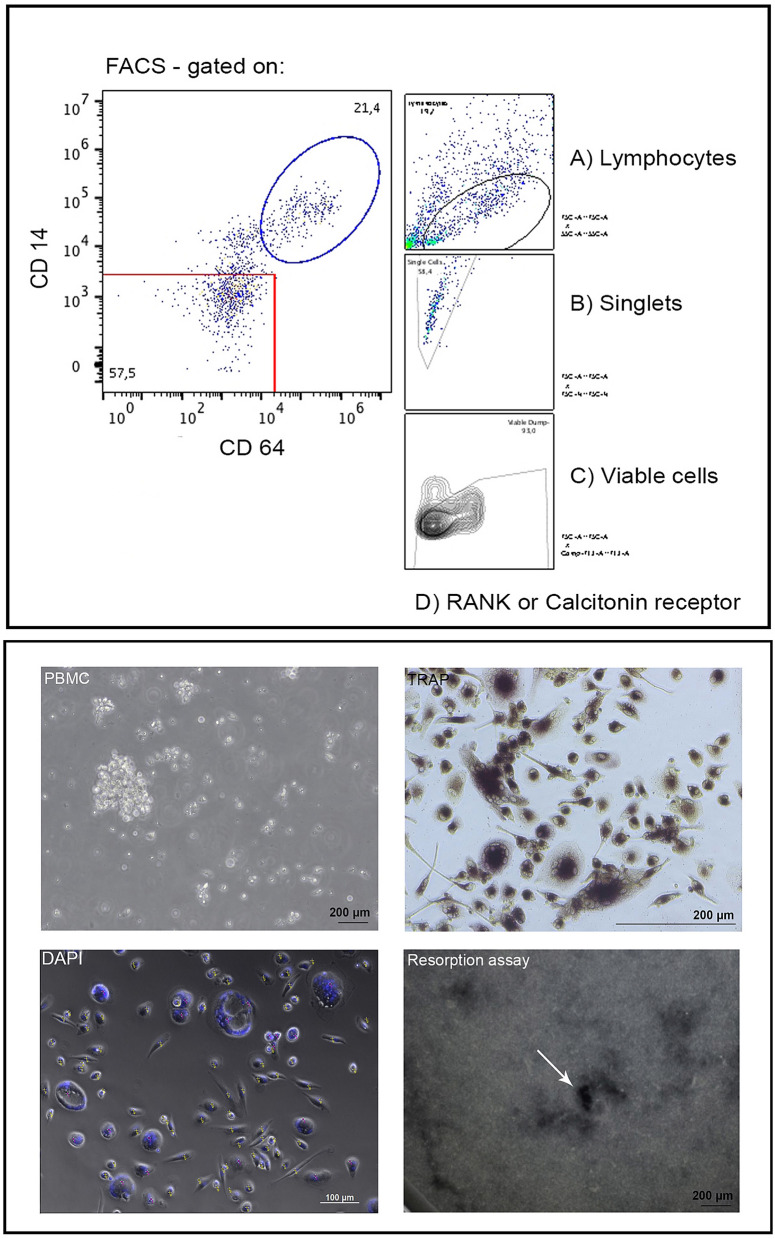
Figure 2.
Settings of the gates for FACS analysis are shown in the upper part of the image. In the lower part of the image, representative images of PBMC isolation, TRAP analysis, DAPI stained cell sorting and results of the resorption assay are presented. The white arrow in the lower right image indicates pit formation in the resorption assay. Yellow points in the DAPI staining mark mononuclear cells whereas red dots mark multinuclear ones.

