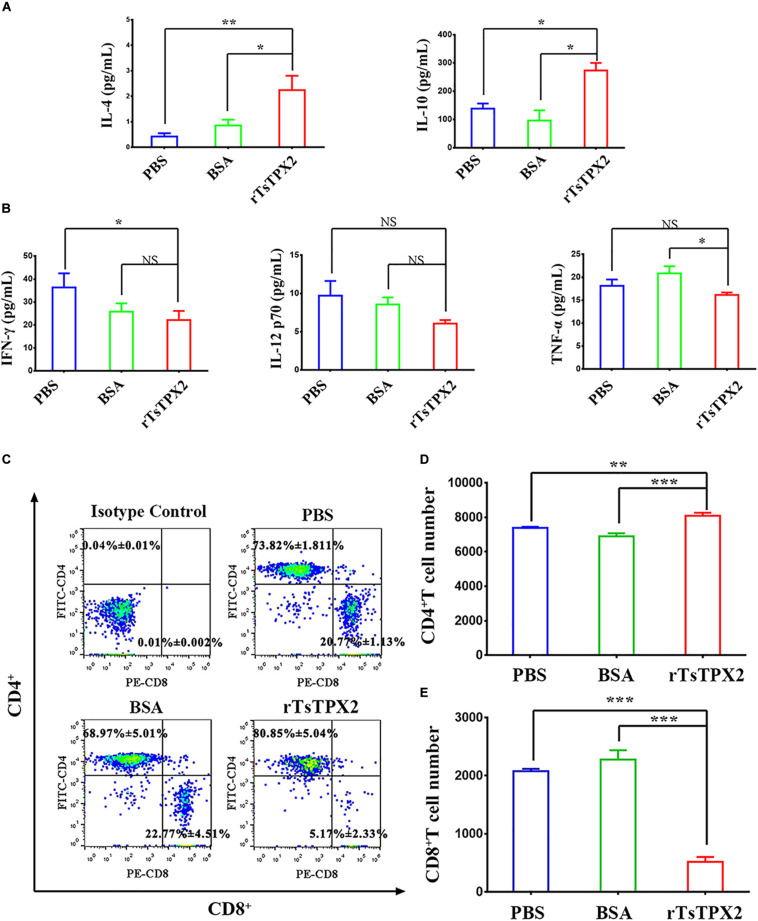
FIGURE 2.
rTsTPX2 inhibits Th1 responses in mice. (A) The levels of Th2 cytokines in sera from mice detected by ELISA. (B) The levels of Th1 cytokines in sera from mice detected by ELISA. (C) Analysis of CD3+CD4+CD8– and CD3+CD8+CD4– T lymphocytes. The number on the representative contour plots showing the ratio of each subset out of peripheral lymphocytes. (D) The total number of CD3+CD4+CD8– T cells in blood from mice. (E) The total number of CD3+CD8+CD4– T cells in blood from mice. Experimental groups include mice challenged with PBS as a negative control, BSA as mock control, or rTsTPX2. Statistical analysis was performed with Student’s t-test, and data are mean ± SDs (representative of three experiments). ***P < 0.001, **0.001 < P < 0.01, *0.01 < P < 0.05. n >= 5 mice per group.

