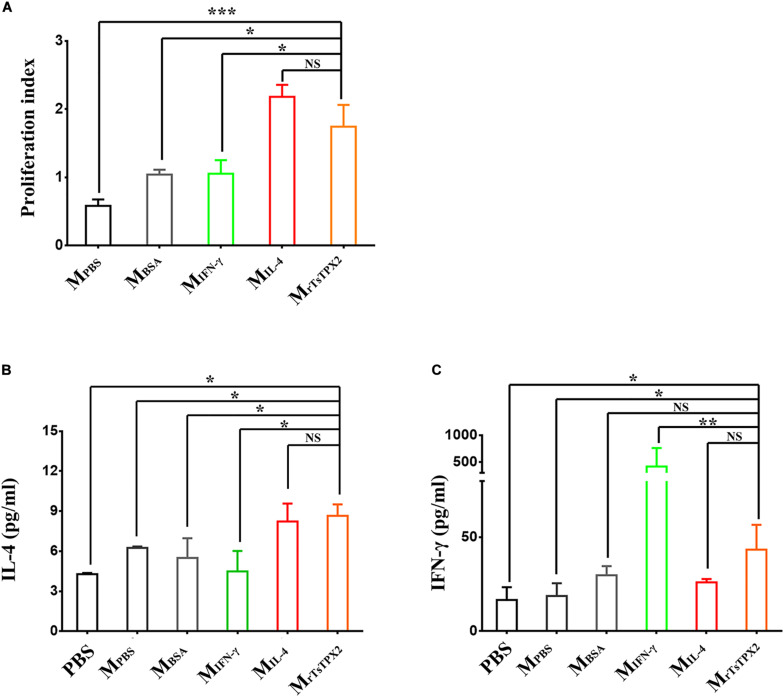
FIGURE 4.
The differentiation and proliferation of CD4+ T cells induced by macrophages. (A) The proliferation index of CD4+ T cells induced by macrophages at 72 h after co-culture, measured by MTs kit. (B) Levels of IL-4 production in supernatant of CD4+ T cells co-cultured with macrophages. (C) Levels of IFN-γ production in supernatant of CD4+ T cells co-cultured with macrophages. CD4+ T cells isolated from healthy BALB/c mice co-cultured with macrophages induced by various stimuli, including PBS as blank control (MPBS), IL-4 as M2 positive control (MIL–4), INF-γ as M1 positive control (MINF–γ), BSA as mock control (MBSA) or rTsTPX2 (MrTsTPX2). The experimental group PBS representative CD4+ T cells dealing with PBS. Statistical analysis was performed with Student’s t-test, and data are presented as mean ± SDs (representative of three experiments). ***P < 0.001, **0.001 < P < 0.01, *0.01 < P < 0.05, NS, not significant. n >= 3 mice per group.

