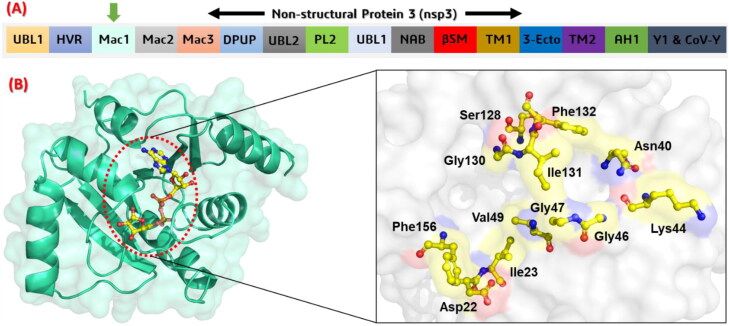
Figure 2.
(A) showing the structural organization of SARs-CoV-2 nsp3. The sixteen different domains area given in panel A. The macrodomain-I used in this study is shown with a green arrow. (B) showing the ADPr (yellow stick) bound structure of macrodomain-I from SARs-CoV-2. In panel B, the active site residues which are involved in interactions with Mac-I are given and labelled. The active site residues are shown in yellow stick colour.

