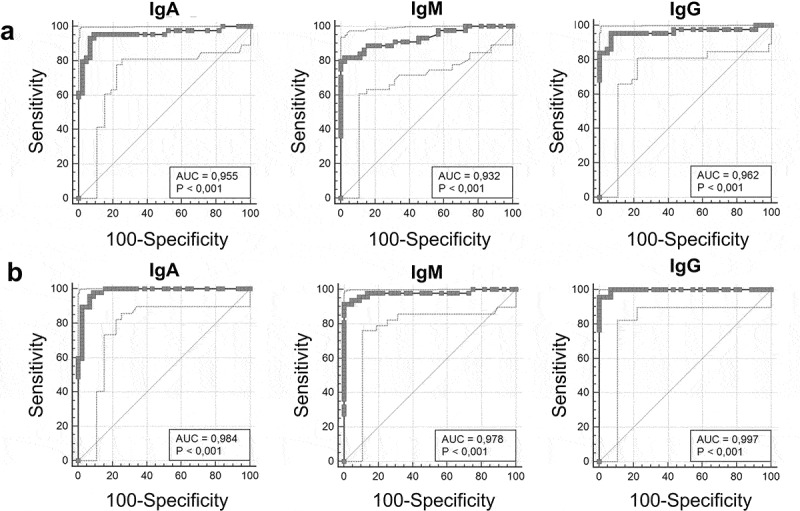
Figure 2.

Anti-SARS-CoV-2 serological tests ROC curves. ELISA IgA, IgM and IgG results for group 1 are shown in Panel A (AUC 0.955, 0.932 and 0.962 respectively); ELISA IgA, IgM and IgG results for group 2 are shown in Panel B (AUC 0.984, 0.978, 0.997, respectively).
