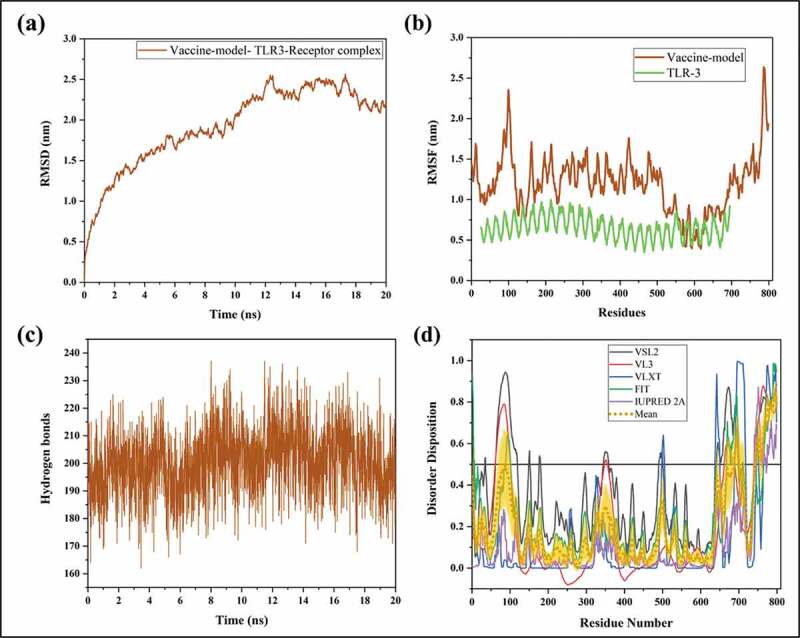
Figure 6.

Illustration of docked vaccine model and TLR-3 complex through molecular dynamics simulations till 20ns. (a) RMSD, (b) RMSF, and (c) Hydrogen bonds. (d) Represents the predisposition of intrinsic disorder in residues of vaccine construct as predicted by PONDR® pool of predictors: PONDR-FIT, PONDR-VSL2B, PONDR-VL3, PONDR-VLXT, and IUPRED 2A. The mean of all predictors is shown in short dotted lines in yellow, and the shadowed area over the mean plot represents its standard error.
