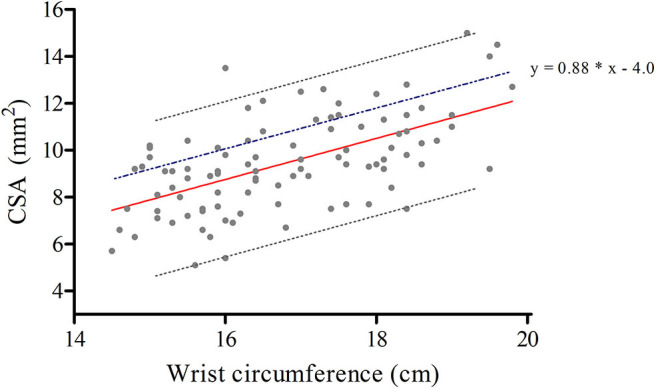
Figure 1.

Regression analysis of the 96 healthy controls for determining the upper limit of normal (ULN) of the cross-sectional area depending on wrist circumference. Regression equations for median values (0.88 * x −5.25, red line), and for the upper limit of normal (0.88 * x −2.0, grey upper dashed line); x being the wrist circumference. The blue dashed line represents our optimised equation for the new ULN (y = 0.88 * x −4.0), adding 1.24 for each y.
