Figure 3.

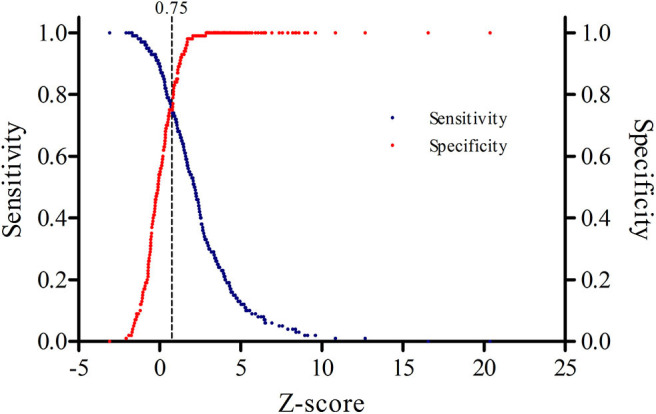
Decision plot showing that a z-score of 0.75 (dotted vertical line) represents the optimal cut-off point for the highest sensitivity and specificity.

Decision plot showing that a z-score of 0.75 (dotted vertical line) represents the optimal cut-off point for the highest sensitivity and specificity.