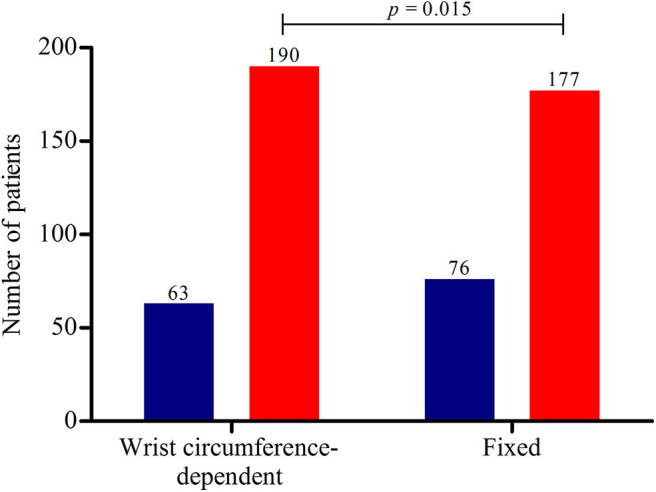
Figure 4.

Ultrasound results of the 253 patients. The red bars represent the number of patients with abnormal ultrasonography results and the blue bars normal ultrasonography results. Using a wrist-circumference dependent upper limit of normal (ULN), 190 patients (75.1%) had abnormal US results vs. 177 patients (70.0%) using a fixed ULN of the cross-sectional area of the median nerve of 11 mm2 (p = 0.015). The mean CSA of these 190 and 177 patients with abnormal US results were 14.9 (±4.1) and 15.2 (±4.1), respectively, without a statistically significant difference (p = 0.201).
