

Abstract
As humans move through parts of their environment, they meet others that may or may not try to interact with them. Where do people look when they meet others? We had participants wearing an eye tracker walk through a university building. On the way, they encountered nine “walkers.” Walkers were instructed to e.g. ignore the participant, greet him or her, or attempt to hand out a flyer. The participant's gaze was mostly directed to the currently relevant body parts of the walker. Thus, the participants gaze depended on the walker's action. Individual differences in participant's looking behavior were consistent across walkers. Participants who did not respond to the walker seemed to look less at that walker, although this difference was not statistically significant. We suggest that models of gaze allocation should take social motivation into account.
Keywords: gaze, social interaction, wearable eye tracking, locomotion, active vision
Introduction
Imagine someone walking into her office on a busy workday. She navigates crowds with ease, avoids people absorbed in their phone, greets her coworkers, shakes hands, and exchanges a “pleasure to meet you” with a potential customer. When navigating such varied situations, there are many potential interactions that may occur between two persons, ranging from mutual collision avoidance to engaging in a full-fledged conversation. Such interactions can have widely varying outcomes, depending on whether, and how, one engages in the interaction.1 In this article, we are interested in how the visual system, and in particular looking behavior (where one looks and when), is engaged during such potential interactions. Accurate descriptions of looking behavior across a wide range of human interactions are not only relevant for understanding and modeling human social interaction at large (Hessels, 2020) but also for theories of gaze control and active vision (see, e.g., Land & Furneaux, 1997; Hayhoe, 2000). Moreover, descriptions of how looking behavior supports human interaction have important applications in gaming, human-computer interaction, and social robotics (e.g., Skantze, Hjalmarsson, & Oertel, 2014; Ruhland et al., 2015), as well as in pedestrian and evacuation dynamics (Kitazawa & Fujiyama, 2010) and outdoor lighting design (Fotios, Yang, & Uttley, 2015).
Where do people look when they encounter another person and potentially engage in interaction with that person? One could conceive several components to this question that have been addressed in previous research. Where does one look at other humans and human faces? Where does one look during locomotion or crowd navigation? We briefly summarize important findings from previous work addressing these questions before we introduce our specific research questions.
Looking behavior to humans and human faces
Since the pioneering work by Buswell (1935) and Yarbus (1967), it has often been assumed that humans have a bias to look at the bodies and faces of other humans. In a recent review, Hessels (2020) concludes that when no restrictions are placed on observers on where to look or what to do, there is a tendency to fixate humans rather than objects, human faces rather than human bodies, and eyes rather than, for example, the nose or mouth. Looking behavior to human bodies and faces further depends on a number of different factors, including at least (a) the task given to the observer, (b) the content of the portrayed face, and (c) the individual whose looking behavior is investigated.
That the task given to an observer affects looking behavior to human bodies and faces was shown by, for example, Birmingham, Bischof, and Kingstone (2008) and Buchan, Paré, and Munhall (2007). Birmingham et al. (2008) presented participants with photographs of one or multiple people in different settings. One participant group was tasked to “look at, and then describe each image” (p. 346), while another participant group was tasked to “describe where attention is being directed in the scene” (p. 346). The group that was tasked to describe the image looked more at the bodies and less at the eyes of the portrayed persons than the group that was tasked to determine the direction of attention of the portrayed persons. In a similar vein, Buchan et al. (2007) investigated the effect of different tasks on looking behavior to the face and facial features. They showed that their participants looked more often and longer at the eyes of a face when judging its emotion than when having to report what the face was saying. Task-relevant areas are thus actively sought out by the observer.
Even in the absence of a specific task given to an observer (free-viewing), looking behavior to human bodies, faces, and facial features furthermore depends on what the portrayed persons are doing. Võ, Smith, Mital, and Henderson (2012) had participants conduct a free-viewing experiment with videos portraying faces. When the portrayed faces were talking and audible, participants’ fixations were distributed over the eyes, nose, and mouth. When the videos were muted, fewer fixations to the mouth occurred (although see Foulsham & Sanderson, 2013). When the portrayed face looked straight into the camera, the eyes were fixated more often. Finally, when the face moved quickly, the nose was fixated more. Võ et al. (2012) proposed that looking behavior to faces can be considered an information-seeking process where observers seek out parts of the scene that are relevant. In a similar vein, Scott, Batten, and Kuhn (2019) presented participants with videos of an actor carrying out various behaviors (holding a monologue, manual actions, and misdirection). They showed that the actor's face was looked at most during monologues, while the actor's hands were looked at most during manual actions and misdirection. When the actor spoke, the actor's face was looked at more, but interestingly, gaze was then directed more to the eyes than to the mouth.
A more recent observation is that looking behavior to faces is highly idiosyncratic (see, e.g., Peterson & Eckstein, 2013; Mehoudar, Arizpe, Baker, & Yovel, 2014; Kanan, Bseiso, Ray, Hsiao, & Cottrell, 2015; Arizpe, Walsh, Yovel, & Baker, 2017). While on average there is a bias to fixate the eyes, some people tend to predominantly look at the eyes, while others tend to look at the mouth. Interestingly, these preferred fixation locations represent observer-specific optimal viewing locations in order to judge facial identity (Peterson & Eckstein, 2013). Idiosyncratic patterns of looking behavior are further task specific (Kanan et al., 2015) and stable over periods of 1.5 years (Mehoudar et al., 2014).
Importantly, the studies above have been conducted using photographs or videos of human bodies or faces. As other researchers have pointed out (e.g., Kingstone, 2009; Risko, Richardson, & Kingstone, 2016), one should not assume that these findings generalize to physical situations where there is a possibility for interaction. One potential reason for this is that there is an ontological difference between the world depicted in photographs or videos that one observes and the world that an active agent is engaged in (whether virtual or real; see, e.g., Bracker, 2017). In a virtual or physical world, one's actions may have consequences. Looking another in the face may have dire consequences, for example when that person is aggressive. To investigate participants’ looking behavior when in the presence of another person, Laidlaw, Foulsham, Kuhn, and Kingstone (2011) placed participants in a waiting room with a live confederate or with a videotaped confederate displayed on a screen. They showed that participants are keen to look at a videotaped confederate in a waiting room but not at a live confederate (for recent work on this topic, see Holleman, Hessels, Kemner, & Hooge, 2020). The phenomenon of not looking at other people out of courtesy has been well described by Goffman (1966). It is known as “civil inattention,” and is an important phenomenon to consider in encountering others that may or may not engage one in interaction.
Once one is engaged in interaction with another, civil inattention plays no clear role anymore. Dyadic conversation is a clear example, and much observational (Kleinke, 1986) and eye-tracking work (e.g., Ho, Foulsham, & Kingstone, 2015; Hessels, Holleman, Kingstone, Hooge, & Kemner, 2019) has been conducted on this topic. As it is not concerned with looking behavior during the initiation of potential interactions, we will not address it here further.
Looking behavior during locomotion and crowd navigation
Another topic of research that is crucial for our research question is that of the role of the visual system in locomotion and crowd navigation. This research topic has a long history (see, e.g., Gibson, 1958; Warren, 1998), with an emphasis on, for example, how locomotion is controlled by visual information and how crowd behavior emerges from visual control of locomotion of multiple individuals (Moussaïd, Helbing, & Theraulaz, 2011; Bonneaud & Warren, 2012; Warren, 2018).
Studies investigating looking behavior during locomotion and crowd navigation have necessarily been conducted in contexts where actions have consequences, that is, where one can potentially bump into another agent (whether virtual or real). Croft and Panchuk (2018), for example, showed that participants’ looking behavior was related to which pedestrian-avoidance strategy they employed (passing behind the pedestrian or rushing ahead). In other work, Jovancevic-Misic and Hayhoe (2009) showed that participants quickly learned which other pedestrians were likely to be on a collision course with them and fixated these potential colliders proactively in subsequent encounters. In a more recent virtual reality study, Meerhoff, Bruneau, Vu, Olivier, and Pettré (2018) showed that walking agents that were at risk of colliding with the participant-controlled agent were often fixated. These walkers were then subsequently avoided. These studies combined show that gaze is directed at other agents that are particularly relevant (e.g., those that are on a collision course). Furthermore, where gaze is directed in the world and when (i.e., at oncoming pedestrians or not) can predict where one will walk.
Toward an integration: Looking behavior and potential interaction
As the opening example of our article makes clear, there is more to encounters with other people than simply avoiding them. Often, one needs to engage in interaction with other people or vice versa. For example, one might need to ask for directions, or one is approached by a street marketeer. Where do people look in such situations? Here, it is paramount to stress that one's gaze direction serves not only visual-information seeking (e.g., Võ et al., 2012) but may also be considered as a signal to somebody else. For example, looking someone in the eye for a long time may be perceived as aggressive. Thus, the question becomes when and where do people look when they simultaneously have to (a) navigate one's surroundings, (b) perceive what nearby agents might be up to, and (c) engage in or refrain from interactions effectively?
With regard to navigating one's surrounding while perceiving what nearby agents may be up to, we recently conducted a study (Hessels, van Doorn, Benjamins, Holleman, & Hooge, 2020). We investigated whether gaze needs to be directed to other people in order to navigate human crowds effectively or whether gaze can be flexibly directed to other people to seek out potential social affordances (e.g., does a person afford potential interaction or not?). Participants had to walk through a lab center in the opposite direction from three groups of walkers (i.e., actors carrying out a particular walking instruction). Participants were first instructed to avoid any collisions. Next, they were instructed to avoid collisions and assess whether oncoming walkers made eye contact with them. We found that participants’ gaze location in the world was task dependent. When instructed to assess eye contact, participants looked more to the heads of oncoming walkers than when they were instructed only to avoid collisions. Interestingly, the increased number of fixations to the walkers’ heads came at the cost of looking at the walkers’ bodies. Thus, during crowd navigation, there is enough flexibility to fixate different parts of the body of oncoming pedestrians to seek out social affordances.
With regard to engaging or refraining from potential interaction while navigating one's surroundings, Foulsham, Walker, and Kingstone (2011) instructed participants to walk around campus while their gaze direction was measured with a wearable eye tracker. They found that participants looked more at people when they were far away than when they were near the participant. One explanation the authors give is that this was due to the social context: Participants might, for example, have looked away at near distances to avoid engaging in interaction with oncoming pedestrians. In other work, Gallup, Hale, et al. (2012) have shown that people tend to shift their gaze based on where others in their proximity look but that this occurs more often when those people are oriented away from the person (Gallup, Chong, & Couzin, 2012). The authors stated that “it appears that pedestrians do observe these cues but choose either not to use this information to direct their own gaze since this may enhance the possibility of social interaction, or do so in a more covert manner” (p. 522). In sum, these studies suggest that looking behavior may help to avoid potential interactions during locomotion.
In the present study, we extend these studies by investigating where people look during locomotion while they encounter others who may engage them in interaction. We are interested in the similarities and the differences in looking behavior across participants and whether differences in looking behavior predict whether one engages in interaction. Our specific research questions are as follows.
First, we investigate whether looking behavior during locomotion depends on the potential to interact with an oncoming person. We operationalize this by having different walkers carry out behaviors that vary in their potential to interact, from ignoring a participant to greeting him or her or handing out a flyer. We investigate whether and how looking behavior differs across the different walker-behaviors: How much, when, and where do participants look at an oncoming walker depending on what behavior he or she is carrying out? While previous research with videos has shown that gaze location depends on the behavior of the depicted agent, we are unaware of studies investigating looking behavior to real people carrying out different behaviors.
Second, we investigate whether participants’ looking behavior is idiosyncratic and consistent across the different walker-behaviors. Previous research has shown that whether individuals look predominantly at the upper, middle, or lower part of the face generalizes from static pictures to people engaged in the world (Peterson, Lin, Zaun, & Kanwisher, 2016). Yet, no studies have thus far investigated idiosyncratic looking behavior to walkers across different behaviors carried out by those walkers.
Finally, we investigate whether looking behavior predicts engagement in interaction with the walker. Previous studies (Foulsham et al., 2011; Gallup, Chong, et al., 2012, Gallup, Hale, et al., 2012) have suggested that gaze may be directed in such a way that potential interactions during locomotion are avoided, but no studies have investigated the relation between looking behavior and the subsequent engagement of individuals in the interaction.
These research questions combined will allow us to discuss what a theory or model of gaze during locomotion and potential human interaction needs to consider and address how this may be achieved in existing theories. Because our interest is in the phenomenon that models of gaze behavior during locomotion and potential human interaction need to be able to explain, we take a predominantly descriptive (or exploratory) approach in this study.
Methods
Participants
Participants were recruited at the Faculty of Social and Behavioral Sciences of Utrecht University. Twenty-three people volunteered (8 male, 15 female, mean age years, range 22–31 years). Written informed consent was obtained from all participants prior to the start of the study. The study was approved by the Ethics Committee of the Faculty of Social and Behavioral Sciences at Utrecht University (protocol number FETC18-075) and adhered to the Declaration of Helsinki.
Apparatus and setup lab center
Participants’ eye movements were measured with the Tobii Pro Glasses 2 (firmware version 1.25.3-citronkola) and the Tobii Pro Glasses Controller (version 1.95.14258) running on an HP Pavilion X2 with Windows 10. The Tobii Pro Glasses 2 were, apart from practical reasons of availability, used as the data quality of this device is less susceptible to slippage of the eye tracker with respect to the head compared with other wearable eye trackers (Niehorster, Santini, et al., 2020). The Tobii Pro Glasses 2 recorded eye movements at 50 Hz. The scene camera of the Tobii Pro Glasses 2 recorded the view in front of the participant at 25 Hz. The recordings were conducted in the lab center of the Faculty of Social and Behavioral Sciences, through which each participant walked one round. The lab center consists of four corridors at 90 turns (see Figure 1). The corridors are between 40 and 45 m long and 2.25 m wide. While walking a round through the lab center, participants would encounter seven individual walkers and one walker couple at regular intervals.
Figure 1.
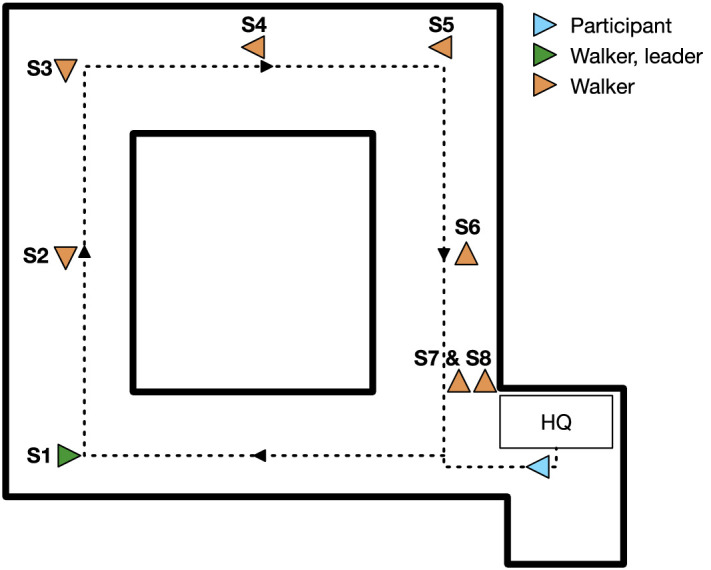
Schematic overview of the lab center with the starting positions of all walkers (orange arrowheads, with first walker in green arrowhead) and participant (light blue arrowhead). Arrowheads point into the walking direction. Note that one walker was actually a couple of walkers (see description of the walker-behaviors). The black arrows indicate the route of the participant. Headquarters (HQ) indicate where the eye-tracking glasses were fitted. Each starting position is characterized by its number. The corridors are between 40 and 45 m in length and approximately 2.25 m wide.
The nine walkers each carried out one of eight behaviors (two walked together as a couple) as they approached and walked past the participant. The following behaviors were scripted (see Figure 2 for staged photographs of these behaviors). Each is characterized by a letter.
-
A.
Pass the observer while looking at your phone.
-
B.
Pass the observer while looking straight ahead and saying nothing.
-
C.
Pass the observer and say hi when you are about 3 m from him or her.
-
D.
Confuse the observer about which side you are going to pass (passing dance).
-
E.
Walk toward the observer and stop (stand still) when you are about 3 m from him or her. Once the observer passes, continue walking.
-
F.
Hand out leaflet to the observer.
-
G.
Walk toward the observer and say “cool glasses!” to the observer while pointing at your own eyes when you are about 3 m from him or her.
-
H.
Pass the observer while you are talking to your fellow walker (suggestions for topics: work experience, favorite holiday destinations, hobbies).
Figure 2.
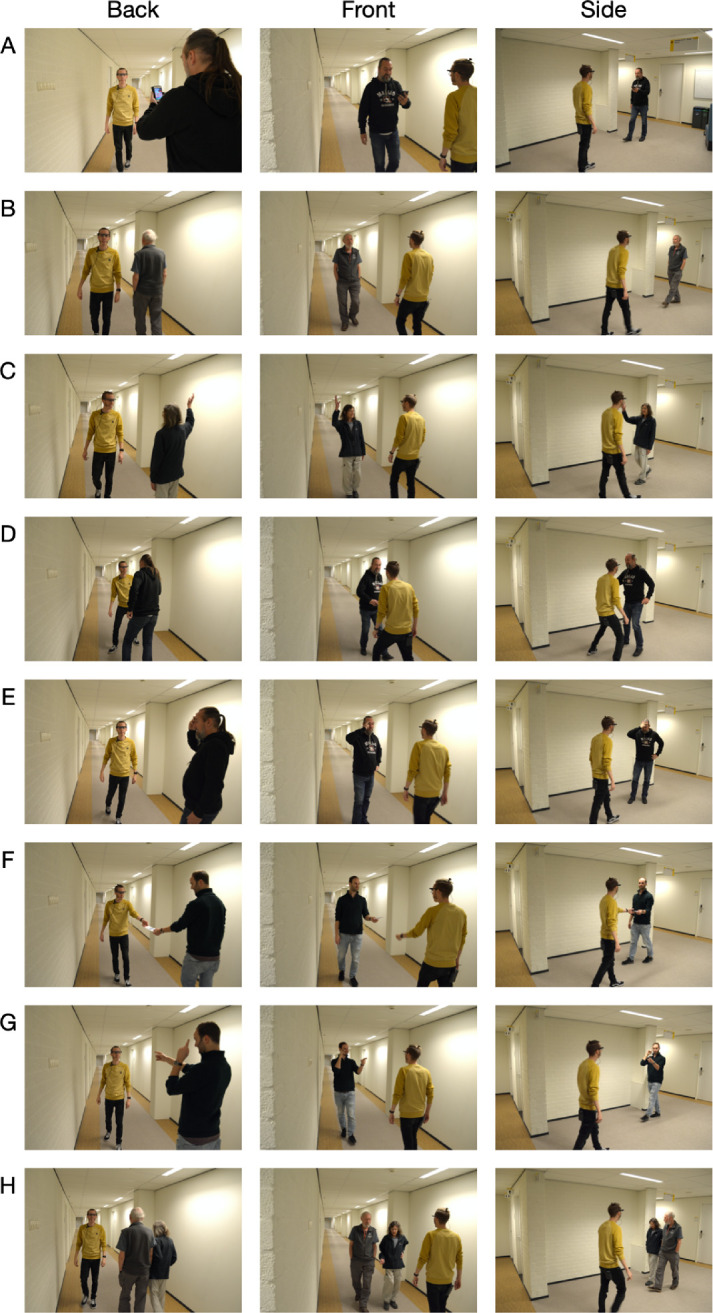
Staged photographs of the eight behaviors carried out by the walkers in the present study. In this staged example, the participant wears a yellow sweater, while the walkers wear gray, blue, or black sweaters. Behaviors are depicted from three sides. Letters correspond to the following walker-behaviors: looking at a phone (A), looking straight ahead (B), saying “hi” (C), passing dance (D), standing still (E), handing out a leaflet (F), saying “cool glasses” (G), and the talking couple (H).
Each walker would begin at one of eight starting positions, indicated in Figure 1 by S for starting position and a number. The two walkers forming the talking couple obviously started from the same position. For each starting position, instructions were given for when the walker should start walking:
-
S1.
Start walking when the participant starts walking.
-
S2.
Start walking when the walker ahead starts.
-
S3.
Start walking when the walker ahead turns the corner.
-
S4.
Start walking when the walker ahead starts.
-
S5.
Start walking when the walker ahead turns the corner.
-
S6.
Start walking when the walker ahead starts.
-
S7.
Start walking when the walker ahead turns the corner.
-
S8.
Start walking when the walker ahead is halfway through the corridor.
Note that the walker(s) located at S1 were hidden partly behind a pillar so that they could observe the participant without being easily seen. No instructions were given on which side of the corridor the walker should walk. However, most walkers, except for the walker trying to engage the participants in a passing dance, walked on the right side of the corridor. All walker-behaviors and starting positions were trained 1 week before the experiment took place.
Randomization
In order to relate differences in the participants’ looking behavior to the walker-behavior, we need to ensure that these differences cannot be ascribed to the order in which each behavior is encountered or the specific walker carrying out the behavior. Therefore, each walker was trained to carry out two of the eight behaviors. Furthermore, the starting position of each walker was varied for each experimental trial (one experimental trial is one participant walking a round through our lab center). Walkers carried out the same behavior for every eight trials in a row, after which they switched to their other rehearsed behavior. Starting position was varied for each trial such that every walker started from each possible starting position every eight trials. In other words, every eight trials was a Latin square for the different starting positions.
Procedure
Given the nature of the experiment, that is, a wearable eye-tracking experiment in a lab center with multiple walkers present to carry out different behaviors, all trials were planned on the same afternoon. When participants arrived in the coffee room on the same floor as the lab center, they were each presented with an information letter and a consent form by one of the experimenters (author JK or GH). After giving written informed consent, participants were led to an adjacent room one by one. In this room, two of the other experimenters (authors JB and IH) placed the Tobii Pro Glasses 2 on the participant and conducted a 1-point calibration and a 9-point validation procedure. When the participant was ready, he or she was picked up by yet another experimenter (author RH) to be taken to the lab center for the final instructions prior to the experiment.
The participant was instructed to walk one round through the lab center without bumping into anything or anyone. When the participant started walking, the first walker started walking as well (see above). Completing one round took approximately 2 min, after which the participant was escorted back to the other experimenters where another 9-point validation procedure took place. Hereafter, the eye tracker was removed and the participant was asked to fill in an exit interview with a number of demographic questions (age, sex, handedness, etc.), a question about whether their vision and audition were normal or corrected-to-normal, and what they thought the study was about. The next participant would then be taken to the lab center for the next trial.
Immediately after each participant had left the lab center, the walkers were directed to the next starting position in preparation for the succeeding participant. One of the experimenters (author AD) was positioned at the far end in the lab center to check when all walkers had taken their respective places. When the walkers were ready, she notified author RH through the use of a walkie-talkie (Motorola TLKR-T80 Extreme Quad) that the lab was ready. Author RH was fitted with an earpiece to make sure that participants did not overhear this notification. Only after the notification would the next participant be sent into the lab center.
The duration between the start of succeeding trials was around 4 min. With 23 participants, this led to a total approximate measuring time of 1.5 hr. Upon completing all 23 trials, a central debriefing took place where the walkers were revealed as actors. We furthermore briefly introduced our research questions to the participants and walkers.
Data analysis
With our experiment, we investigated looking behavior in relation to walker distance and behavior. We therefore needed to know (a) where participants looked in the world at each point in time and (b) the distance at which walkers were from the participant at each point in time. In order to achieve these goals, we structured our data analysis as follows. First, the scene camera videos were coded for when walkers were in view of the participant. Second, we used OpenPose (Cao, Hidalgo, Simon, Wei, & Sheikh, 2018) to find the location of each walker within the scene camera and estimate the participant-walker distance. Third, we automatically mapped gaze samples to areas of interest (AOIs) in the world using our analyzed video data. Using previously validated techniques (Hessels, Kemner, van den Boomen, & Hooge, 2016; Hessels, Benjamins, et al., 2018; Cao et al., 2018), we were able to construct a fully automatic AOI analysis, which is thus completely reproducible. Automatic and reproducible AOI analyses are to be preferred over manual annotation, as (a) it is often problematic to formalize the rules that human coders apply during manual annotation, (b) these rules are not necessarily applied consistently, and (c) it is time-intensive to repeat the analysis (Hooge, Niehorster, Nyström, Andersson, & Hessels, 2018). Each step of our analysis is explained in detail below.
Video coding
The videos that were recorded from the scene camera of the Tobii Pro Glasses 2 were analyzed to determine when the participants’ rounds began and ended and when participants passed walkers. The videos were coded using Datavyu 1.3.7 (Datavyu Team, 2014) by authors RH and JB. The times at which the following six types of events occurred were coded:
-
(1)
Beginning of a round: first frame in which the participant moves into the direction of the first hallway.
-
(2)
Walker (or walker couple) comes into view of the eye-tracker scene camera.
-
(3)
Walker (or walker couple) is fully out of view of the eye-tracker scene camera.
-
(4)
End of a round: first frame in which the experimenter (author RH) is in view.
-
(5)
Nonwalker (see below) comes into view of the eye-tracker scene camera.
-
(6)
Nonwalker is fully out of view of the eye-tracker scene camera.
The mean absolute difference in the coded times between the two coders was 68.23 ms ( ms). The large standard deviation was primarily due to coding the start and end of the round. When excluding these codes, which are not relevant to our analyses, the mean absolute difference was 21.72 ms ( ms). The averaged times were subsequently used to constrain the OpenPose analysis (see below).
Note that nonwalkers were persons who happened to be present in our lab center during our measurements but had nothing to do with our experiment. Although researchers were informed of the experiment taking place in the lab center, we could not prevent the incidental person walking through the lab center. These episodes were coded from the scene camera videos to allow us to exclude them from the analyses. In total, this led to the exclusion of two episodes from two trials.
Estimation of walker location and distance using OpenPose
The 25-keypoint model2 from OpenPose version 1.5.1 (Cao et al., 2018) was run on all scene camera videos on a Windows 10 system with an Intel Core i7-4770 CPU and two Nvidia GeForce GTX1080Ti GPUs, allowing us to process the scene camera videos at 25 Hz. An example of the OpenPose output (i.e., the 25 body keypoints) is given in Figure 3.
Figure 3.
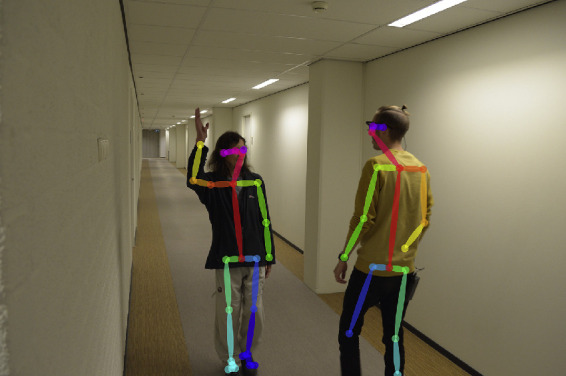
OpenPose body keypoints for one of the staged pictures of a walker-behavior. Note that not all keypoints are always identified (e.g., the missing left foot of the person in the yellow sweater). Note also that some keypoints are identified even if they are occluded (e.g., the right wrist of the person in the yellow sweater).
Matching walkers across frames
As OpenPose returns keypoints for all detected people separately for each video frame, additional processing is required to match OpenPose keypoints to a specific walker identity. This was achieved as follows. First, OpenPose keypoint detections with confidence values under 0.2 were removed. These confidence values range from 0 to 1. The threshold of 0.2 was chosen after trying out various settings. This value was chosen such that body keypoints were still being detected when the walker was only partially in view. Second, for each walker, our algorithm selected the frame at which this walker disappeared from view of the eye-tracker scene camera. Then, the algorithm went back in time frame by frame until a person was detected by OpenPose with a distance between the neck and hip keypoints exceeding 250 pixels. That person was identified as the walker. Keypoints detected in previous frames (up to the frame at which the walkers came into view based on the video coding procedure) were assigned to the walker provided that (a) the neck-hip distance did not exceed 1.1 times the neck-hip distance in the previous successfully matched frame and (b) the average position in the scene camera image of the detected keypoints had not shifted more than 20% of the vertical and horizontal resolution since the previous successfully matched frame. Finally, in order to allow for missed detections by OpenPose, we accepted gaps up to a maximum of 10 frames (400 ms) since the last successfully matched frame. For the walker couple, a further step was implemented such that identities within the couple were assigned based on the smallest change in mean keypoint location from frame to frame.
Upon assessment of the matching procedure, we found that in four instances, a walker was not identified correctly (i.e., it was missed). Varying the parameter for the initial neck-hip distance (which was initially set to 250 pixels in the scene camera image) led to these instances being correctly identified. Yet, this always came at the cost of introducing errors for other instances of walker identification. Upon closer examination, it turned out that these four instances belonged to one walker carrying out one particular behavior (walking toward the observer and stopping at about a 3-m distance from the participant). To solve the missing identification of this walker, the parameter for initial neck-hip distance was set to 150 pixels for these four instances, ensuring correct identification of all walkers in all recordings.
Appendix B contains pseudocode for the walker-matching procedure, so that readers may easily implement our method in their future studies.
Estimating participant-walker distance
In order to estimate the participant-walker distance given the size of a walker in the scene camera video, we asked each walker to measure the physical distance between their neck and hip, using the respective OpenPose keypoint locations as reference. This meant that for each walker, we had (a) the physical neck-hip distance and (b) the neck-hip distance for that walker in pixels of the scene camera video for each video frame. Then, we placed an object of known size (40, 60, and 80 cm) at fixed distances in front of the eye-tracker scene camera to establish the relation between physical object size, distance, and object size in the scene camera image (see also Appendix A). The resulting relation is depicted in Figure 4.
Figure 4.
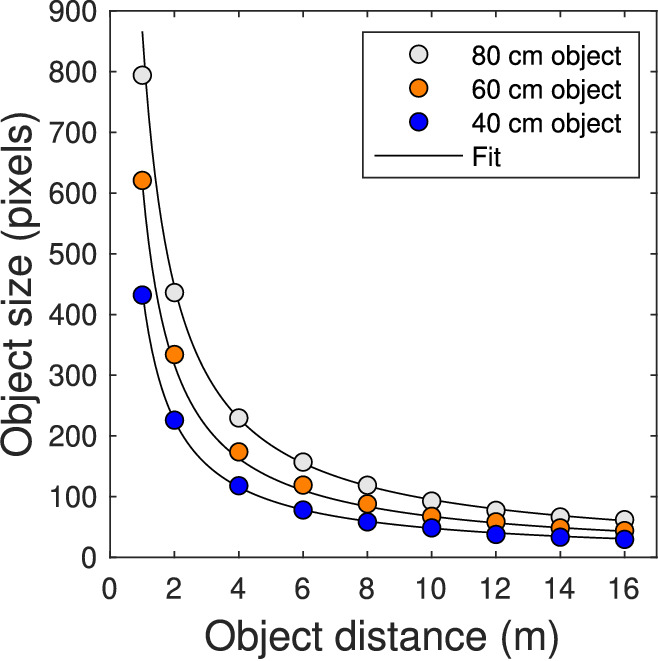
Relation between physical object size, object distance, and object size in the scene camera image of the Tobii Pro Glasses 2. A 90-cm object with marking at every 10 cm was placed at various distances in front of the eye-tracker scene camera. From snapshots of this video recording, sizes of a 40-, 60-, and 80-cm object were determined in the scene camera image. The black line indicates the results of fitting a function to the resulting data points.
A function was then fitted to the data, which are depicted in Figure 4. The function was then rewritten such that participant-walker distance could be estimated from physical size of a walker's neck-hip distance and the corresponding size in pixels in the scene camera. The resulting relation was
| (1) |
where is the participant-walker distance in meters, is the size of the walker's neck-hip distance in pixels in the scene camera image, and is the physical neck-hip size in centimeters. The fit for as a function of revealed that this relation approaches the theoretically expected relation. The fit for as a function of is conveniently described as an exponential function.
Using Equation 1, the participant-walker distance was estimated per walker. Note that for the walker-couple (scripted behavior H), two walkers were present in the scene camera image. As we did not instruct which of these two walkers was to walk on the left or right of the other, we estimated which walker was which from the OpenPose output. For this, the average neck-hip distance in pixels for frames in which two people were detected by OpenPose was determined. The detected walker with the lowest mean neck-hip distance was assigned the lowest physical neck-hip size, and the other walker was assigned the remaining physical neck-hip size.
The resulting participant-walker distance can be considered the distance between the participant and a plane perpendicular to an axis with origin in the scene camera moving forward into the world. We elaborate on this in Appendix A.
Analysis of the eye-tracking data
Eye-tracking data quality
The quality of the eye-tracking data was assessed as in Hessels et al. (2020). We looked at three characteristics: (a) the accuracy, or systematic error in the eye-tracking data, (b) the precision, or variable error in the eye-tracking data, and (c) data loss, that is, the amount of valid gaze data recorded compared to the amount expected. The systematic error was assessed manually by the first author looking at the gaze replays of the validation at recording start and end in GlassesViewer (Niehorster, Hessels, & Benjamins, 2020). This was done by determining whether the gaze location was close to the 0.9-cm-wide red dot at the center of the validation marker (a 4.5-cm-wide black ring). The 0.9-cm red dot subtended 0.77 assuming an eye height of 170 cm and a distance between observer and wall of 65 cm (see Hessels et al., 2020, for details). The variable error was estimated by the median root mean square sample-to-sample deviation (RMS). The RMS deviation was computed for each recording using GlassesViewer. A 300-ms moving window was slid over the horizontal and vertical components of the gaze position signal, after which the median RMS deviation was calculated in order to exclude large RMS values due to fast eye movements (i.e., saccades). A two-dimensional RMS deviation was subsequently calculated as the root of the sum of squares. Data loss was estimated as the percentage of samples without a gaze coordinate. Data loss occurs not only due to blinks but also due to problems in tracking the eyes, for example (see, e.g., Hessels, Andersson, Hooge, Nyström, & Kemner, 2015).
Mapping gaze to areas of interest
In order to draw conclusions about when and where participants looked at the walkers, gaze data needed to be mapped to the OpenPose keypoints (see Appendix B for pseudocode of the gaze-mapping procedure). The scene camera recorded at 25 Hz and thus OpenPose keypoint data were available at 25 Hz, whereas the eye camera recorded at 50 Hz. In order to couple the gaze data to the OpenPose data, we first upsampled the OpenPose data to 50 Hz using linear interpolation. Hereafter, we assigned each gaze sample to a video frame. The offset between the timestamps of the interpolated OpenPose data and the gaze data was empirically found to be between −0.2 and 0.2 ms.
We then computed the distance between the gaze coordinates and the locations of the OpenPose body keypoints. A gaze coordinate was assigned to the OpenPose keypoint for which the distance was smallest, provided that the distance did not exceed 150 pixels. This method is known as the limited-radius voronoi tessellation (LRVT) method and has been shown to be an objective method with regard to area-of-interest (AOI) shape (i.e., no subjective choice is made for what the AOI shape should look like). Moreover, it was shown to be the most noise-robust AOI method in sparse stimuli, that is, when there are not many elements of interest in the visual scene (Hessels et al., 2016). In order to give meaning to the 150 pixels, a reference image of sizes is presented in Figure 5. The 150 pixels was chosen such that it allows for some systematic error (inaccuracy) in the gaze-position signal, even at the shortest participant-walker distance. Importantly, we compare gaze on the walker across the walker-behaviors, and the same settings are used for each behavior. As a sensitivity analysis, we reran the analyses using 100 and 200 as the LRVT radius. The results were not meaningfully affected. Thus, the relative differences between walker-behaviors are maintained even when varying the LRVT radius.
Figure 5.
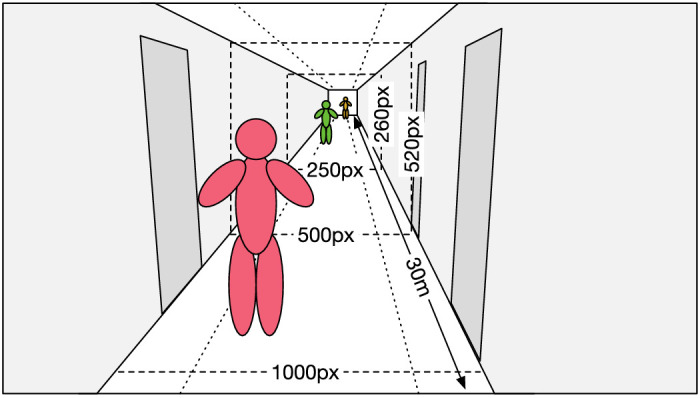
Reference image for the size of walkers and the hallway in the scene camera image. Width and height of the hallway are given in pixels for a number of distances. The walkers are presented at the size they would take up at approximately a 3-, 15-, and 30-m distance, respectively.
Note that for walker-behavior H (i.e., the talking couple), only those samples were considered in which OpenPose keypoints were available for both walkers. If the OpenPose keypoints for one walker were missing, it was impossible to conclude whether the participant was in fact not looking at either walker.
In the following analyses, we report three sets of AOIs. First, we report gaze on the walker (any body keypoint). Second, we report gaze on the separate keypoints to visualize the distribution of gaze over the walker. Third and finally, we report gaze on three body AOIs: the upper body (head, neck, and shoulder keypoints), arms (elbows and wrist keypoints), and lower body (hips and lower body keypoints) to compare participants’ looking behavior across walker-behaviors. The AOI division of upper body, arms, and lower body was made based on a consideration of the systematic error (inaccuracy) in the gaze position signal. At the largest participant-walker distances that we were interested in, the systematic error in the gaze position signal may not allow us to determine whether the participant looks directly at the face of the walker. For example, previous research has established that one cannot generally distinguish gaze on facial features using wearable eye trackers at conversation distance (Niehorster, Santini, et al., 2020). Here we investigate gaze on walkers at larger interpersonal distances and thus choose a cruder AOI division, which includes a larger AOI for the face/head area (upper body). Thus, our analyses are not conducted at the resolution of the systematic error (inaccuracy) in the gaze position signal.
As stated, the primary aim of our study is description of gaze behavior across multiple potential interactions during locomotion. Therefore, we follow advice from Rousselet, Pernet, and Wilcox (2017) and adopt detailed visualizations and bootstrapping techniques to visualize differences in participants’ looking behavior between walker-behaviors. For most analyses that follow, we employ percentile bootstrapping using the Harrell-Davis estimator to acquire 95% confidence intervals around the median and deciles. This is implemented using the MATLAB function decilespbci provided by Rousselet et al. (2017). The number of bootstrap samples was 2,000. The only exception is the analysis of gaze on walkers over time, for which we employed Gaussian smoothing and weighted statistics as implemented by van Leeuwen, Smeets, and Belopolsky (2019).
Results
Eye-tracking data quality and exclusion
We assessed the accuracy of the eye-tracking data as in Hessels et al. (2020) and did not see any reason for excluding eye-tracking data from any participants based on the accuracy. Figure 6 depicts values for precision and data loss for each participant. Based on the observed data quality, as well as subjective assessments of the recordings in GlassesViewer (Niehorster, Hessels, et al., 2020), we decided to exclude participants with more than 20% data loss or an RMS deviation of 60 pixels. These exclusion criteria led to the exclusion of eye-tracking data from three participants (see Figure 6). Two of the three recordings with a data loss value above 20% also had the highest RMS deviation values. Data loss in the third recording could be characterized by intermittent data loss for one of the eyes, precluding the estimation of the gaze location with respect to the video image. The 20% value also corresponds well with previous observations with the Tobii Pro Glasses 2, that is, a data loss range of 3–18% (Hessels et al., 2020). The deviation of 60 pixels is 2.5 times smaller than the LRVT radius (see Hessels et al., 2016) of our AOIs. As such, we deem deviation values below 60 pixels not to be problematic in assigning gaze to an AOI. Importantly, each included participant contributed gaze data for the analysis of every walker-behavior, even though data loss for some participants could be up to 20%.
Figure 6.
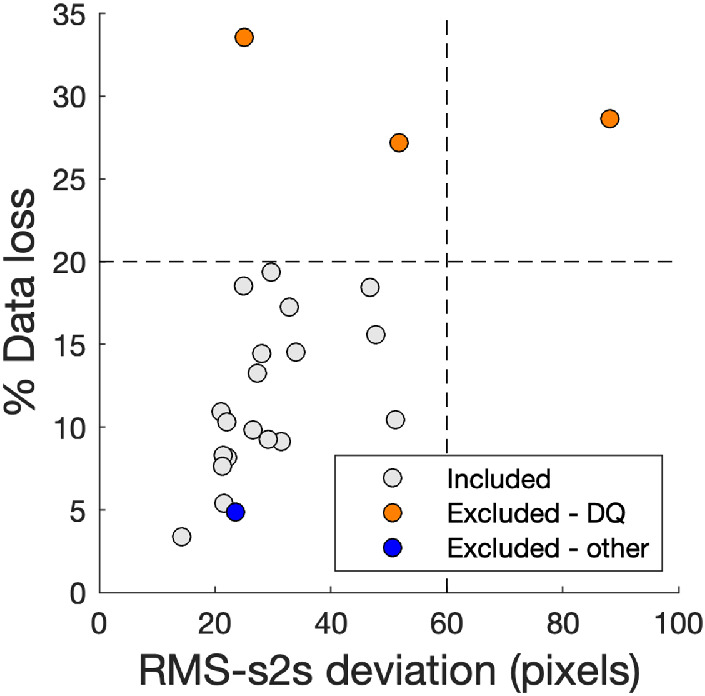
Eye-tracking data quality measures for participant exclusion. Each participant is represented by a marker. The dashed lines represent the exclusion criteria based on eye-tracking data quality (precision and data loss). Root mean square sample-to-sample (RMS-s2s) deviation is used as a measure for precision. Pixels refer to the scene camera image (resolution of 1,920 by 1,080 pixels).
One participant was further excluded from the subsequent analysis. When she was fitted with the wearable eye tracker, she took her glasses off and notified us that she could not see well enough without glasses. She was therefore excluded from the analysis. At her request, we allowed her to complete the experiment nonetheless. The majority of the remaining participants reported normal or corrected-to-normal vision. A few participants reported that they might need glasses or contact lenses but do not suffer any inconvenience due to their not wearing correction. These participants were therefore not excluded. In the end, eye-tracking data from 19 out of the 23 participants were included.
Gaze on walkers
Our first research question was whether participants’ looking behavior depends on the walker-behavior. In this section, we show during which walker-behavior walkers were looked at most and when. In the next section, we show how gaze was distributed over the walker's body for the different walker-behaviors. Finally, we investigate the idiosyncrasy of participants’ looking behavior and whether looking behavior predicts engagement in interaction with the walkers.
We first investigated which walker was looked at the longest by computing the total time each participant spent looking at the walker. These results are visualized in Figure 7. As is visible from Figure 7, participants did not look equally long at every walker. Participants clearly looked longest at the walker who tried to engage them in a passing dance (walker-behavior D; median 3.47 s, 95% CI [2.95, 4.08 s]). This is evident from the fact that the 95% confidence intervals of the median overlap only slightly with those of walker-behavior F (hand out leaflet, median 2.64 s, 95% CI [2.34, 3.08 s]), but do not overlap with the confidence intervals of any of the other walker-behaviors. Differences in total looking time to the remaining walker-behaviors were much smaller. However, the single walkers who ignored the participant (walker-behavior A, median 1.84 s, 95% CI [1.35, 2.20 s], and walker-behavior B, median 1.74 s, 95% CI [1.36, 2.07 s]) were looked at least. Interestingly, the talking couple (walker-behavior H, median 2.35 s, 95% CI [1.84, 2.70 s]) also ignored the participant but was not among the walker-behaviors least looked at. The remaining walker-behaviors fell somewhere in between. The walker who said “hi” (C) was looked at for a median 1.99 s (95% CI [1.65, 2.63 s]), the walker who stood still (E) a median 2.26 s (95% CI [1.83, 2.87 s]), and the walker who said “cool glasses” (G) a median 2.47 s (95% CI [1.97, 2.83 s]).
Figure 7.
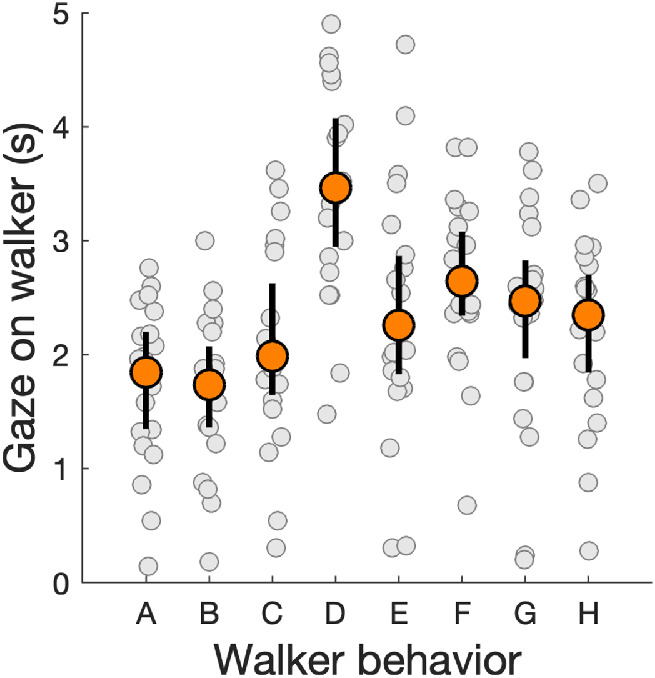
Gaze on walkers for each walker-behavior. Each participant is represented by a gray marker. Orange markers represent the median time in seconds that a walker was looked at and error bars represent 95% confidence intervals of the median, both of which were acquired through bootstrapping using the MATLAB-function decilespbci provided by Rousselet et al. (2017). These values are computed by summing all gaze samples for which gaze was within 150 pixels of an OpenPose keypoint and is reported under the assumption that each gaze sample was exactly 20 ms (the Tobii Pro Glasses 2 records gaze at 50 Hz). Walker-behaviors correspond to looking at a phone (A), looking straight ahead (B), saying “hi” (C), passing dance (D), standing still (E), handing out a leaflet (F), saying “cool glasses” (G), and the talking couple (H).
Gaze on walkers as a function of time to pass and distance
Although the analysis of total looking time to the walker gives insights into which walker was likely to be looked at overall, one wonders how differences in looking behavior to the walkers manifest over time. As the participant and walker approach each other, some walkers will direct themselves toward the participant, while others will keep looking straight ahead and will ignore the participant. We therefore investigated when in time walkers were most likely to be looked at. As the gaze position signals of the participants did not have identical timestamps, we needed a method to convert the different signals into the same time signal. For this, we used a Gaussian smoothing filter for the individual gaze data over time using the implementation by van Leeuwen et al. (2019). For each participant, a signal containing 1s (walker was looked at) and 0s (walker was not looked at) for each sample was smoothed. We then investigated (a) how likely walkers were looked at as a function of time to pass (i.e., time until the walker passed out of the scene camera image) and (b) how likely walkers were looked at as a function of participant-walker distance. The kernel size was set to 0.3 s for the time analysis and 0.5 m for the distance analysis. All individual smoothed data were then averaged using a weighted method, whereby we accounted for the fact that not all participants contributed an equal number of data points to each time or distance. In a similar vein, a weighted standard error of the mean was estimated for each time series to allow comparisons between walker-behaviors (see van Leeuwen et al., 2019, for details). As stated before, our analysis is primarily descriptive. We did not carry out statistical analyses on these time series, as doing this effectively means carrying out 28 pairwise comparisons (van Leeuwen et al., 2019). Moreover, we did not have specific hypotheses to test on these time series.
Figure 8 depicts the proportion of participants who gazed at a walker as a function of time to pass (where t = 0 s corresponds to the last point in time at which the walker was visible in the scene camera image) and distance (using the estimation outlined above) for four walker-behaviors (the remaining walker-behaviors are reported in Appendix C). As is visible from the left panel in Figure 8, the walkers who handed out a leaflet (walker-behavior F) and the talking couple (walker-behavior H) were most likely to be looked at by all participants at the same time (as indicated by values close to 1). Interestingly, this peak occurred slightly earlier in time (and at a farther distance) for the talking couple (walker-behavior H) than for the walker handing out a leaflet (walker-behavior F). The walker saying “hi” to the participant (walker-behavior C) had a slightly lower peak at around 1 s time to pass. The walker looking at their phone (walker-behavior A) was least likely to be looked at just prior to passing. The right panel in Figure 8 gives insight in the distance at which walkers were likely to be looked at, separated again by walker-behavior. Interestingly, at a distance of 12 m, all walkers were almost equally likely to be looked at.
Figure 8.

Proportion of participants who gaze at the walker as a function of time to pass (left panel) and participant-walker distance (right panel). Each line represents a different walker-behavior. The lines were acquired by Gaussian smoothing individual gaze data and subsequently computing a weighted average. Shaded areas represent the weighted standard error of the mean. Four walker-behaviors are reported here (looking at a phone (A), saying “hi” (C), handing out a leaflet (F), and the talking couple (H)). The remaining four walker-behaviors are reported in Appendix C.
The analyses reported in this section, and those in Appendix C, suggest that the more walkers direct themselves toward the participant, the more likely they are to be looked at. The talking couple (walker-behavior H) seems to be the exception. These walkers are not directed toward the participant but are nonetheless likely to be looked at by all participants around 2–3 s before passing. Interestingly, the timing of the peak differs notably from those for walkers who direct themselves clearly toward the participant.
Gaze on walker bodies
Following the analysis of which walkers were most likely to be looked at and when, we asked ourselves where participants looked on the body of each walker. Is it the case that where walkers are looked at depends on the specific behavior they carry out? And if so, do participants then primarily look at the “informative” regions of the walker? Each gaze sample was assigned to a specific OpenPose body keypoint, with which we could visualize on which body part walkers were looked at. The top two rows in Figure 9 depict the number of gaze samples assigned to each body keypoint for each of the eight walker-behaviors. The more gaze samples assigned to a keypoint, the larger the radius of the blue circles. As the Tobii Pro Glasses 2 recorded gaze at 50 Hz, each gaze sample took 20 ms. Inspection of the intersample interval revealed jitter of up to 0.3% of the sampling frequency and no missed frames. As such, the sum of the number of gaze samples is proportional to the total time a walker was looked at, that is, the sum of gaze samples multiplied by 20 ms, which ranged from 1.5 to 4 s across the different walker-behaviors (see Figure 7). As a total looking time in seconds is easier to interpret than a number of gaze samples with arbitrary duration, we discuss the findings below in terms of total looking time.
Figure 9.

Total looking time and relative total looking time to parts of the walker bodies for each of the eight walker-behaviors. Each walker body consists of 25 points, which correspond to the OpenPose body keypoint of the 25-keypoint model. The top two rows represent total looking time to parts of the walker bodies. The radius of the blue circles represents the number of gaze samples assigned to a keypoint, and under the assumption that the Tobii Pro Glasses 2 records gaze at exactly 50 Hz, it is proportional to the total looking time. The bottom two rows represent relative total looking time to parts of the walker bodies for each of the eight walker-behaviors. The radius of the orange circles represents the number of gaze samples assigned to a keypoint divided by the total number of gaze samples on a walker. Under the assumption that the Tobii Pro Glasses 2 records gaze at exactly 50 Hz, this is proportional to the relative total looking time.
As reported above and again visible from the top two rows in Figure 9, the walker engaging participants in a passing dance (walker-behavior D) was looked at the longest, while the individual walkers in the talking couple (walker-behavior H) were looked at the least (for the analyses of total looking time reported above, the looking times to both walkers are summed). In order to better compare gaze on the walker body across walker-behaviors, we also computed the relative total looking time to each body keypoint for the eight walker-behaviors. These are depicted in the bottom two rows in Figure 9. As visualized here, participants’ gaze for the walker engaging the participant in a passing dance (walker-behavior D) was mostly divided over the upper body (head, neck, and shoulder) and arms. For the walkers saying “hi” or “cool glasses” (walker-behaviors C and G), participants’ gaze was mostly directed at the upper body, while for the walkers standing still in the hallway or handing out a leaflet (walker-behaviors E and F), gaze was mostly on the upper body and arms. For walkers looking at their phone or looking straight ahead and the talking couple, gaze was mostly directed at the upper body, although less so than for walker-behaviors C and G.
In order to quantitatively compare participants’ looking behavior to the walker bodies across the different walker-behaviors, we computed deciles and 95% confidence intervals of the deciles for the entire distribution of participants’ looking behavior to three AOIs: the upper body (head, neck, and shoulder), arms, and lower body. In this manner, we not only can compare whether the medians or means differ across two walker-behaviors but also can visualize how the entire distributions differ (Rousselet et al., 2017). This is particularly relevant as distributions of gaze over AOIs are generally not normally distributed, and large interindividual differences may be observed. The 95% confidence intervals were acquired using bootstrapping. For simplicity's sake and in order to ease comparison, we compare three different walker-behaviors that differ in the degree to which they are directed toward the participant. Comparisons for the remaining five walker-behaviors are given in Appendix C.
Figure 10 depicts distributions of the proportion of gaze participants spent looking at the upper body, arms, and lower body for walkers looking at their phone (walker-behavior A), saying “hi” (walker-behavior C), and handing out a leaflet (walker-behavior F). These three walker-behaviors are either not (walker-behavior A), verbally (walker-behavior C), or verbally and manually (walker-behavior F) directed at the participant. As can be seen in the left panel in Figure 10, the median proportion (Decile 5) of gaze at the upper body of the walker saying “hi” was higher (median 0.80, 95% CI [0.64, 0.87]) than for the two other walker-behaviors (walker-behavior A median 0.47, 95% CI [0.38, 0.63]; walker-behavior F median 0.52, 95% CI [0.43, 0.58]). Moreover, as visible from the middle panel, the median proportion of gaze at the arms of the walker handing out a leaflet was higher (median 0.33, 95% CI [0.30, 0.38]) than for the walker saying “hi” (median 0.13, 95% CI [0.10, 0.19]), although there was some overlap with the walker looking at their phone (median 0.25, 95% CI [0.15, 0.32]). Finally, as visible from the right panel, the median proportion of gaze at the lower body was highest for the walker looking at their phone (median 0.24, 95% CI [0.09, 0.35]), although the 95% confidence interval shows more overlap with the walker saying “hi” (median 0.06, 95% CI [0.03, 0.13]) and the walker handing out a leaflet (median 0.15, 95% CI [0.06, 0.24]) than for the other two AOIs.
Figure 10.

Proportion of gaze on the upper body, arms, and lower body for three walker-behaviors (looking at phone, saying “hi,” and handing out a leaflet). Each marker represents the decile value for the participant distribution. Error bars represent 95% confidence intervals around the decile values acquired through bootstrapping using the MATLAB function decilespbci provided by Rousselet et al. (2017).
The analyses reported in this section suggest that participants’ gaze on the body of the walkers depended on what that walker was doing, and that gaze was attracted to the location that seems intuitively relevant for that behavior (head for walker-behavior C, arms for walker-behavior F). Similar patterns are observed for the other walker-behaviors (see Appendix C).
Individual differences in looking behavior
Our second research question was whether participants show idiosyncratic looking behavior that is consistent across walker-behaviors. The distributions shown in Figure 10 already make clear that participants differed in how their gaze was distributed over the walker bodies. We further investigated idiosyncratic looking behavior by determining how consistent individuals were in how long they looked at the walkers and where on the body they did so. We computed Spearman rank correlations across the different walker-behaviors to determine this consistency. As we had eight walker-behaviors in total, this led to 28 unique comparisons of two walker-behaviors. We computed Spearman correlations for the absolute time walkers were looked at, the relative time walkers were looked at, and the proportion of gaze on the upper body, arms, and lower body AOIs.
As is visible from Figure 11, the median correlation coefficient was positive for all measures of looking behavior. The correlations were higher for the proportion of gaze on the separate body part AOIs (upper body median 0.50, 95% CI [0.42, 0.56]; arms median 0.30, 95% CI [0.22, 0.36]; lower body median 0.44, 95% CI [0.39, 0.50]) than for the absolute (median 0.24, 95% CI [0.15, 0.30]) and relative (median 0.25, 95% CI [0.12, 0.34]) measures of gaze on the walker. This means that participants were somewhat consistent in how long they looked at a walker, but they were even more consistent in where they looked on the body of a walker. This is particularly interesting as we have shown before that where participants looked on the body of the walker depended on the walker-behavior. As such, this suggests that where one looks at an oncoming walker depends not only on the behavior of the oncoming walker but also on the individual doing the looking.
Figure 11.
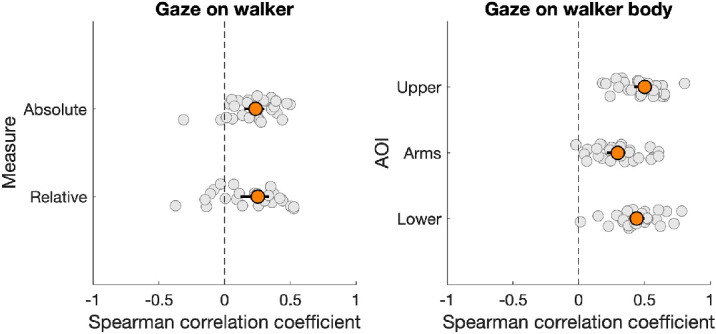
Spearman rank correlations between walker-behaviors for the (proportion of) time a walker (left panel) or body AOI (right panel) was looked at. Each gray marker represents one combination of two walker-behaviors. Orange markers represent the median correlation coefficient and error bars represent 95% confidence intervals of the median, both of which were acquired through bootstrapping using the MATLAB function decilespbci provided by Rousselet et al. (2017).
Looking behavior and engagement in interaction
Our third and final research question was whether one's looking behavior relates to the engagement in potential interactions. We had three walker-behaviors for which participants could be considered to “engage” in an interaction with the walker. These are (a) the walker saying “hi,” (b) the walker saying “cool glasses,” and (c) the walker handing out a leaflet. Manual annotation of the scene camera videos revealed that all participants accepted the leaflet, while only one participant did not say “hi” back. However, 7 out of 23 participants did not respond verbally to the walker saying “cool glasses.” Note that annotation of the verbal responses was done prior to the analysis of the gaze data and in absence of a gaze overlay. These participants either did not say anything or merely gave a small laugh. As such, we compared whether these two groups differed in the proportion of time they looked at the walker. As 4 of the participants were excluded from our analysis (see above), we compared 6 nonresponders against 13 responders.
As is visible from Figure 12, four nonresponders were among the five participants who looked proportionally least at the walker, while two of the nonresponders looked around 80% of the time at the walker. The median proportion of gaze on the walker by the nonresponders was 0.54 (95% CI [0.33, 0.77]), while the median proportion of gaze on the walker by the responders was 0.75 (95% CI [0.69, 0.85]). Although there was not a lot of overlap between the 95% confidence intervals of the median, a Mann-Whitney U test revealed that the difference was not statistically significant at an alpha of 0.05 ().
Figure 12.
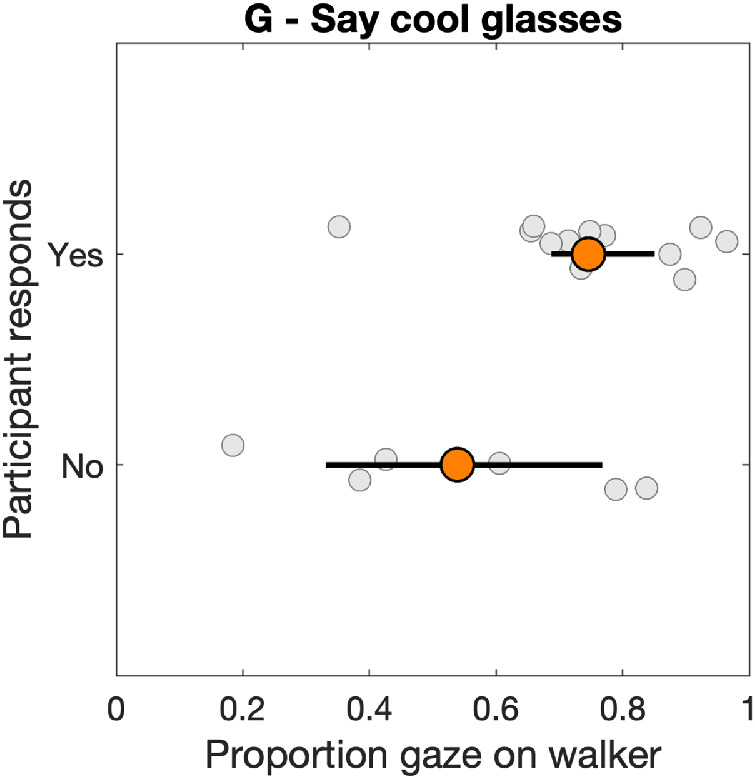
Proportion of gaze on walker as a function of whether participants responded to the “cool glasses” comment by one of the walkers. Each gray marker represents one participant. Orange markers represent the median and error bars represent 95% confidence intervals of the median, both of which were acquired through bootstrapping using the MATLAB function decilespbci provided by Rousselet et al. (2017).
Discussion
We investigated where people look during locomotion while they encounter others who may engage them in interaction. We studied both the similarities and the differences in looking behavior across participants and whether differences in looking behavior predict whether one engages in interaction. We summarize our main findings, after which we discuss potential avenues to modeling gaze during locomotion and potential human interaction.
Our first main finding pertains to how much and when participants looked at the different walkers. Our results suggest that the more walkers direct themselves toward the participant in their behavior, the more they are looked at. Walkers who ignored the participant and looked straight ahead or on their phone were looked at least, while walkers who handed out a flyer or tried to engage the participant in a “passing dance” were looked at most. The exception to the rule is the talking couple. These walkers are not directed toward the participant but to each other, yet are also likely to be looked at. Notably, the peak likelihood that the talking couple was looked at was 2–3 s prior to passing the participant, while the peak likelihood was later (i.e., 1–2 s prior to passing) for the walkers who directed themselves toward the participant. Why might the talking couple be looked at more than the other walkers who directed themselves away from the participant? We consider two potential explanations. First, it may be that gaze was more readily assigned to a walker in the talking couple as less space was left in the hallway to look elsewhere. The two walkers took up a large portion of the width of the hallway (around 50%). Therefore, if a participant looked toward the end of the hallway, the gaze position was closer to a walker for the talking couple than when just one walker was present. However, if this were the case, then we might expect that gaze was mostly assigned to the body keypoints to the right of the rightmost walker (the walking couple passed the participants on the left from the participant's perspective on all but one occasion). Figure 9 clearly shows that this is not the case. An alternative explanation is that the conversation between the two walkers attracted the gaze of the participant, that is, to overhear or attend part of the conversation.
Our second main finding is that walkers tended to look at different body parts for the different walker-behaviors. It seems that the body part that was looked at was intuitively relevant for what that walker was doing. For example, participants looked relatively more at the upper body (head, neck, and shoulders) for walkers saying “hi” and “cool glasses” than they did for the walkers who did not verbally address the participant. Similarly, participants looked relatively more at the arms of the walkers handing out a flyer or standing still in the hallway (see Appendix C) than they did for walkers who did not reach out an arm. We thus extend previous research that has shown that participants look at areas of the body of a person depending on what that person does (Scott et al., 2019). Critically, we show that this is also the case when participants share the same physical space with their passers-by and thus can interact with them in a direct way, as opposed to when they observe others in a video.
Previous research has shown that looking behavior to faces is highly idiosyncratic (see, e.g., Peterson & Eckstein, 2013; Mehoudar et al., 2014; Kanan et al., 2015; Arizpe et al., 2017). Here, we investigated to what degree our participants were consistent in how long they looked at walkers and where they looked on the body of the walkers. In other words, we investigated idiosyncratic looking behavior to whole human bodies (including faces), not faces specifically. We showed that participants were somewhat consistent in how long they looked at walkers (with median correlations of around 0.25). Participants were even more consistent in how they distributed their gaze over the body of the walker (with median correlations between 0.3 and 0.5). This finding is particularly intriguing given that there were also quite large differences in where walkers were looked at depending on what the walkers were doing. For example, the median proportion of gaze directed at the upper body for the walker saying “hi” was around 0.8, while it was lower than 0.5 for the walker looking at her phone. Thus, although participants looked more at the upper body overall, the relative differences in how long they looked at the upper body were partly maintained. Combined, these findings make clear that where one looks at an oncoming walker depends not only on what that walker is doing but also on the individual who is doing the looking.
Finally, we investigated whether looking behavior relates to whether one engages in an interaction or not. Out of the three walker-behaviors that a participant could “respond” to, we only observed enough variation for one. That is, some participants responded to the walker commenting “cool glasses,” while others did not. While the participants who did not respond appeared to look relatively less at the walker than the participants who did respond, the difference was not statistically significant. Given the small sample sizes for this comparison (13 vs. 6 participants), we cannot draw any firm conclusions on this question. Future studies should be helpful in targeting this particular question, bearing in mind that potential interactions are chosen such that they elicit enough variation in participant behavior.
As we noted in our introduction, our findings are relevant in the context of theories or models of gaze during locomotion and potential human interaction, and their applications in social robotics. What does such a model need to consider, given our findings? And what aspects of our findings can be accurately captured in existing models? The main candidate is a model of gaze based on visual routines theory (Hayhoe & Ballard, 2005, 2014). This theory derives from research on looking behavior during everyday activities, in which it has been shown that the gaze location in space is tightly linked to the task being carried out, for example, when making tea (Land, Mennie, & Rusted, 1999), making sandwiches (Hayhoe, 2000), reading music, and playing table tennis (Land & Furneaux, 1997). Land et al. (1999) concluded that even for highly automated processes, gaze is directed to the task-relevant locations in the world at every step of the process, stating that this “must be a common phenomenon in everyday life” (p. 1311). The basic principles of the visual routines theory are aptly illustrated in Figure 1 by Hayhoe (2017). Overarching “cognitive goals” such as “walking across the street” are subdivided into subtasks (monitoring context, avoiding obstacles, etc.). It is assumed that there is a specific fixation location in the visual world that may be informative for each subtask (i.e., the visual routines). The choice for which subtask to update by looking at a location in the world is based on the expected reward of completing a subtask and the uncertainty about its current state. The use of visual routines is indeed an elegant method for modeling gaze in many different behaviors, which seems “at first blush intractable, given the diversity and complexity of visually guided behavior” (Hayhoe & Ballard, 2014, p. R622).
Models based on visual routines theory are applicable when the “cognitive goal” can be divided into clear subtasks, for example, by experimenter observation. The question is whether a clear subtask division may be identified for encounters and potential interactions with others (as in the opening example of our article). In our experiment, participants were asked to navigate a lab center and avoid collisions. If this instruction is framed into a task-structure of (a) maintaining a certain heading and (b) avoiding obstacles, with each subtask having a relevant fixation location in the world, this would not predict the differences in looking behavior to the various walkers that our participants encountered. For example, the walker looking at their phone and the walker saying “hi” were equally easy to avoid, yet were looked at differently by the participants. As such, we would have to suggest subtasks post hoc that may predict the differences in gaze on the various walkers. The individual differences in gaze on the walkers (which were consistent across the various walker-behaviors) might then be explained with different reward weights for a subtask of engaging in interaction, for example. Thus, the visual routines theory may be useful in modeling our findings. However, one wonders whether our situation is constrained enough that clear visual routines with corresponding locations in the world that have to be fixated can be identified. Moreover, it is likely that such a subtask division might not generalize beyond our specific context. That might be problematic when one considers, for example, the development of an assistive robot meant to assist in a nursing home and engage in meaningful interactions with the elderly.
Another approach that makes sense is suggested by Dautenhahn (2007). She argues that
an alternative viewpoint towards AI is to propose that one particular aspect of human intelligence, namely social intelligence, might bring us closer to the goal of making robots smarter (in the sense of more human-like and believable in behaviour); the social environment cannot be subsumed under ‘general environmental factors’, i.e. humans interact differently with each other than with a chair or a stone. (p. 681)
A more generalizable approach to modeling gaze during locomotion and potential human interaction may be to consider the social context the human is embedded in. A human who is navigating through the world and might engage in (or refrain from) interactions with others can be said to be socially motivated (or unmotivated). We surmise that this social motivation might be a useful attribute in modeling gaze during locomotion and potential human interaction. Recent work on social anxiety corroborates this idea. Rubo, Huestegge, and Gamer (2020), for example, showed that social anxiety traits were negatively related to the percentage of fixations directed to persons at a near distance while walking through a train station. Thus, high socially anxious individuals tended to look less at other people at a near distance than low socially anxious individuals. See also Hessels, Holleman, Cornelissen, Hooge, and Kemner (2018), who showed that looking behavior in dyadic conversation was related to social anxiety traits, and Rösler, Göhring, Strunz, and Gamer (2020), who showed no relation between social anxiety traits and looking behavior in a waiting room context. Although we have shown in our experiment that consistent differences in looking behavior across participants occur, we cannot attribute this to social anxiety, as we did not assess social anxiety traits.
A principled approach to modeling gaze during locomotion and potential human interaction may thus consider the following aspects. First, there may be “events” in the world that automatically attract gaze, for example, another person calling out one's name or someone running around a corner. Some might consider this “bottom-up” attraction of gaze. Second, humans may be differentially socially motivated, which predicts how likely they are to engage in interaction with others. Note that social motivation need not be implemented as, say, a “social motivation” setting in a robot's software but may rather be considered as something attributed to an agent (human or robot) depending on their likeliness to engage in interaction (which can be implemented in various ways). As such, a robot designed to assist the elderly in a nursing home may be perceived as highly socially motivated, while a robot that cleans the floors in the nursing home but barely exchanges a greeting may be perceived as socially unmotivated. Finally, when an agent engages in particular constrained interactions, models based on visual routines theory may be used, such as for holding a simple face-to-face conversation (see, e.g., Mihoub, Bailly, Wolf, & Elisei, 2015; Hessels et al., 2019). The approach we propose here may be useful in (a) modeling looking behavior to various agents encountered in the world carrying out different behaviors and (b) modeling individual differences in looking behavior across potential human interactions.
In the present article, we have reported looking behavior to human bodies and faces for several potential human interactions during locomotion. Of course, our selection of potential interactions is necessarily limited in scope. There are many more interactions that one may conceive to which a model of gaze during potential human interactions should apply. We hope future research will address both model-based approaches to gaze during potential human interactions and test these empirically across many different human interactions.
Conclusion
In the present article, we have shown that participants’ looking behavior to other walkers during locomotion depended on what that walker was doing, for example, greeting or ignoring the participant. Participants’ gaze tended to be directed toward the most relevant body part for the behavior carried out by a particular walker. Furthermore, we have shown that how long and where a walker is looked at varied across participants but was consistent across walkers. This was particularly the case for where on the walker's body participants looked, more so than how long walkers were looked at. Finally, we investigated whether participant engagement in interaction with the walker was related to their looking behavior. It seemed that participants who did not respond to the walker looked less at him or her, although this difference was not statistically significant. We have discussed our findings in the light of existing theories of gaze allocation. We suggest that modeling social motivation might prove to be a fruitful addition to existing models of gaze allocation.
Data availability
OpenPose and eye-tracking data are available from the authors upon reasonable request. Due to privacy regulations, videos recorded using the Tobii Pro Glasses 2 cannot be made available.
Acknowledgments
The authors RH and GH were supported by the Consortium on Individual Development (CID). CID is funded through the Gravitation program of the Dutch Ministry of Education, Culture, and Science and the NWO (Grant No. 024.001.003). We thank Jos Jaspers, the Department of Educational Sciences, and Chris Dijkerman for the use of the Tobii Glasses 2; Diederick Niehorster for help with the GlassesViewer software; and Ronald Poppe for help with the OpenPose software. Finally, Niilo Valtakari, Remco van Zijderveld, Marlies van Heijst, Nina Dijkstra, Simon Buil, Hans Koning, Emma Boers, Jihane Cherif, Koert Möllers, Femke Ruijs, and Anneloes Kip are gratefully acknowledged for serving as walkers and helping out with the logistics.
Commercial relationships: none.
Corresponding author: Roy S. Hessels.
Email: royhessels@gmail.com.
Address: Experimental Psychology, Helmholtz Institute, Utrecht University, Heidelberglaan 1, 3584CS, Utrecht, the Netherlands.
Appendix A: Estimating participant-walker distance
To uncover the relation between physical object size, distance between object and scene camera, and object size in the scene camera image, we conducted a number of tests. First, we moved a 90-cm object on a plane and an arc in a horizontal direction at 200 cm from the scene camera (see Figure 13A). This yielded different horizontal positions in the scene camera image, as well as different sizes in that scene camera image. The relation between these two is depicted in Figure 13C. Similarly, we moved a 90-cm object on a plane and an arc in vertical direction at 200 cm from the scene camera (see Figure 13B), with the relation between vertical position in the scene camera image and the object size in that image depicted in Figure 13D.
Figure 13.

Relation between scene camera-object distance, position in the scene camera image, and the size of an object in that image. (A) Schematic of the plane (dashed line) and arc (solid line) along which objects were moved in horizontal direction. The shaded gray area represents the field of view of the scene camera. (B) Schematic of the plane (dashed line) and arc (solid line) along which objects were moved in a vertical direction. The shaded gray area represents the assumed field of view during the recording. The shaded green area represents the estimated actual field of view during the recording. (C) Relation between the average horizontal position of a 90-cm object in the scene camera image and its size in that image when moved along a plane (white diamonds) or arc (black circles). (D) Relation between the average vertical position of a 90-cm object in the scene camera image and its size in that image when moved along a plane (white diamonds) or arc (black circles).
When an object is moved horizontally on a plane perpendicular to the axis from the scene camera into the world (see Figure 13A), the size of that object in the scene camera image does not change (Figure 13B), whereas it does when the object is moved along an arc for which each point is at exactly 200 cm from the scene camera. When an object is moved vertically on a plane perpendicular to the axis from the scene camera into the world (see Figure 13C), the size of that object in the scene camera image does, however, change (Figure 13D). This is likely due to the fact that the scene camera is tilted downward rather than forward-facing (see the green triangle in Figure 13B).
Based on the reported findings in Figure 13, we conclude that the estimate of distance used in our study corresponds to the distance between the scene camera and a plane perpendicular to the axis from that scene camera into the world. Note, however, that that plane is tilted backward with respect to the hallway through which our participants walked.
Appendix B: Pseudocode for mapping gaze to walkers
In this appendix, we outline in pseudocode our procedure for mapping the gaze position signal to the walkers. Because there is no standard for how pseudocode should be written, a brief (perhaps superfluous) explanation follows. We use SET to indicate relevant variables that may be set by the experimenter. FOR and END FOR are used to indicate loops. IF, ELSE, AND IF, and END IF are used for conditional actions. DO indicates some action and LOAD indicates that data are loaded into the analysis.
The mapping procedure contains two distinct steps. First, walkers are identified from the OpenPose data and matched across frames. Second, the gaze position signals are mapped to the walker keypoints. Below these two steps are written out in pseudocode. The situation for our walker couple is slightly more complicated and involves keeping track of whether none, one, or two walkers were already identified and matching keypoints to the closest walker. We expect anyone with programming experience to be able to generalize the examples below to this, and potentially more complicated, scenarios.
6.1. Identifying walkers from the OpenPose data and matching across frames
SET initial neck-hip distance in pixels
SET alternative neck hip distance in pixels
SET maximum change factor for neck-hip distance across frames
SET maximum number of frames when walker tracking is lost
SET OpenPose confidence value cutoff
SET maximum horizontal shift in pixels for walker matching
SET maximum vertical shift in pixels for walker matching
FOR recording number is 1 to maximum number of recordings
LOAD frame start and end numbers for each walker (acquired with datavyu)
LOAD OpenPose keypoints per frame
FOR walker number is 1 to 8
IF alternative settings needs to be used
DO use alternative neck-hip distance in this iteration
ELSE
DO use initial neck-hip distance in this iteration
END IF
FOR walker end frame number to walker start frame number with steps of -1
FOR all detected people by OpenPose for this frame
DO remove keypoints with values below confidence cutoff
DO calculate distance between neck and mid hip keypoints
END FOR
IF not already tracking a walker
IF largest neck-hip distance exceeds initial neck-hip distance
DO start tracking walker and add keypoint locationsto walker data
END IF
ELSE already tracking a walker
IF last walker position was more than maximum numberof frames ago
DO save walker data
DO continue to next walker
END IF
FOR all detected people by OpenPose for this frame
DO compute mean difference in keypoint locationto last known walker position
DO compute difference between neck locationand last known neck location
DO compute difference between hip locationand last known hip location
END FOR
DO find detected OpenPose person with smallest meandifference to last known walker position
IF neck-hip distance does not exceed previous known walkerneck-hip distance times change factor
AND IF shift in neck location does not exceed maximumhorizontal and vertical shifts
AND IF shift in hip location does not exceed maximumhorizontal and vertical shifts
DO match walker and add keypoint locations to walker data
END IF
END IF
END FOR frame number
END FOR walker number
END FOR recording number
6.2. Mapping gaze coordinates to the walker keypoints
SET radius for LRVT method
FOR recording number is 1 to maximum number of recordings
LOAD gaze position data (pixels in scene camera image)
FOR walker number is 1 to 8
LOAD walker keypoint locations
DO upsample walker data from 25Hz to 50Hz
FOR every frame for which walker keypoint location is available
DO find gaze sample corresponding to video frame number
DO compute difference between gaze position and every walker keypoint
DO assign gaze to walker keypoint with smallest difference IF it doesnot exceed the LRVT radius
END FOR frame number
END FOR walker number
END FOR recording number
Appendix C: Gaze on walkers and walker bodies
In this appendix, we first present the analysis of gaze on the walker as a function of time to pass and participant-walker distance for the remaining four walker-behaviors not covered in the main text. Second, we present the analysis of gaze on the walker body AOIs for the remaining five walker-behaviors not covered in the main text.
Figure 14 depicts the proportion of participants who gazed at a walker as a function of time to pass (where t = 0 s corresponds to the last point in time at which the walker was visible in the scene camera image) and distance (using the estimation outlined above) for the four remaining walker-behaviors not covered in the main text. As is visible from the left panel in Figure 14, the walker who tried to engage the participant in a passing dance (walker-behavior D) was most likely to be looked at by all participants at the same time (as indicated by values close to 1). The walker saying “cool glasses” to the participant (walker-behavior G) had a slightly lower peak, although the difference is small. The walkers looking straight ahead (walker-behavior B) or standing still in the hallway (walker-behavior E) showed a comparable profile from around 2 s time to pass. The right panel in Figure 14 gives insight in the distance at which walkers were likely to be looked at, separated again by walker-behavior. Interestingly, at a distance of 12 m, all walkers were almost equally likely to be looked at.
Figure 14.

Proportion of participants who gaze at the walker as a function of time to pass (left panel) and participant-walker distance (right panel). Each line represents a different walker-behavior. The lines were acquired by Gaussian smoothing individual gaze data and subsequently computing a weighted average. Shaded areas represent the weighted standard error of the mean. Four walker-behaviors are reported here (looking straight ahead (B), saying “cool glasses” (G), standing still (E), and engaging the participant in a passing dance (D)).
Figures 15 and 16 depict distributions of the proportion of gaze on the upper body, arms, and lower body. As stated above, deciles and 95% confidence intervals for the entire distribution of participants’ looking behavior to the three AOIs (the upper body, arms, and lower body) were acquired such that we could visualize whether and how the entire distributions differ (Rousselet et al., 2017). Figure 15 depicts distributions for the walkers looking straight ahead (walker-behavior B), saying “cool glasses” (walker-behavior G), and standing still in the hallway (walker-behavior E). Figure 16 depicts distributions for the walkers engaging participants in a passing dance (walker-behavior D) and the talking couple (walker-behavior H).
Figure 15.

Proportion of gaze on the upper body, arms, and lower body for three walker-behaviors (looking straight ahead, saying “cool glasses,” and standing still in the hallway). Each marker represents the decile value for the participant distribution. Error bars represent 95% confidence intervals of the decile values acquired through bootstrapping using the MATLAB function decilespbci provided by Rousselet et al. (2017).
Figure 16.

Proportion of gaze on the upper body, arms, and lower body for two walker-behaviors (passing dance and the talking couple). Each marker represents the decile value for the participant distribution. Error bars represent 95% confidence intervals of the decile values acquired through bootstrapping using the MATLAB function decilespbci provided by Rousselet et al. (2017).
Figures 15 depicts a similar comparison as Figure 10, although the three walker-behaviors do not differ as much in the degree to which they are directed at the participant. As can be seen in the left panel in Figure 15, the median proportion (Decile 5) of gaze at the upper body of the walker saying “cool glasses” was higher (median 0.76, 95% CI [0.64, 0.87]) than for the walker standing still in the hallway (median 0.47, 95% CI [0.32, 0.63]), while the median was somewhat in between for the walker looking straight ahead (median 0.57, 95% CI [0.37, 0.76]). Interestingly, as visible from the middle panel, the median proportion of gaze at the arms of the walker standing still (median 0.36, 95% CI [0.28, 0.44]) was highest compared to the two other walker-behaviors (walker-behavior B: median 0.19, 95% CI [0.09, 0.32]; walker-behavior G: median 0.14, 95% CI [0.08, 0.20]). As became clear when watching the videos again, this walker sometimes stood still as if she was to knock on or open a door to one of the labs, potentially making her arm a particularly relevant gaze location for the participants.
As is visible from Figure 16, the distribution of proportion of gaze on the upper body, arms, and lower body did not seem to differ meaningfully between the walkers engaging the participants in a passing dance and the talking couple. This may not be surprising, as there is no single relevant location on the body of the walker that intuitively stands out.
The findings here reported corroborate the conclusion that participants’ gaze on the body of the walkers depended on what that walker was doing, and that gaze was attracted to the relevant location for that behavior (upper body for walker-behavior G, arms for walker-behavior E).
Footnotes
This is aptly captured in movies such as Lola rennt (1998, directed by Tom Tyker) and Groundhog Day (1993, directed by Harold Ramis), where multiple instances of the same encounter are portrayed but where the outcomes are vastly different depending on how the protagonist engages with the other person.
The output format and keypoint locations from this model are described at https://github.com/CMU-Perceptual-Computing-Lab/openpose/blob/master/doc/output.md, accessed February 14, 2020.
References
- Arizpe J., Walsh V., Yovel G., & Baker C. I. (2017). The categories, frequencies, and stability of idiosyncratic eye-movement patterns to faces. Vision Research, 141, 191–203, doi: 10.1016/j.visres.2016.10.013. [DOI] [PMC free article] [PubMed] [Google Scholar]
- Birmingham E., Bischof W. F., & Kingstone A. (2008). Gaze selection in complex social scenes. Visual Cognition, 16, 341–355, doi: 10.1080/13506280701434532. [DOI] [Google Scholar]
- Bonneaud S. & Warren W. H. (2012). A behavioral dynamics approach to modeling realistic pedestrian behavior. Proceedings of the 6th International Conference on Pedestrian and Evacuation Dynamics, Zurich, Switzerland, pp. 1–14.
- Bracker J. (2017). The borders of metalepses and the borders of the image. In Grabbe L. C., Rupert-Kruse P., & Schmitz N. M. (Eds.). Bildverstehen. Spielarten und Ausprägungen der Verarbeitung multimodaler Bildmedien (pp. 93–109). Darmstadt: Büchner-Verlag. [Google Scholar]
- Buchan J. N., Paré M., & Munhall K. G. (2007). Spatial statistics of gaze fixations during dynamic face processing. Social Neuroscience, 2, 1–13, doi: 10.1080/17470910601043644. [DOI] [PubMed] [Google Scholar]
- Buswell G. T. (1935). How people look at pictures: A study of the psychology of perception in art. Chicago, IL: The University of Chicago Press. [Google Scholar]
- Cao Z., Hidalgo G., Simon T., Wei S.-E., & Sheikh Y. (2018). OpenPose: Realtime multi-person 2D pose estimation using part affinity fields. arXiv:1812.08008, pp. 1–14. [DOI] [PubMed]
- Croft J. L. & Panchuk D. (2018). Watch where you're going? Interferer velocity and visual behavior predicts avoidance strategy during pedestrian encounters. Journal of Motor Behavior, 50, 353–363, doi: 10.1080/00222895.2017.1363695. [DOI] [PubMed] [Google Scholar]
- Datavyu Team. (2014). Datavyu: A video coding tool. Databrary Project, New York University, http://datavyu.org.
- Dautenhahn K. (2007). Socially intelligent robots: Dimensions of human–robot interaction. Philosophical Transactions of the Royal Society B: Biological Sciences, 362, 679–704, doi: 10.1098/rstb.2006.2004. [DOI] [PMC free article] [PubMed] [Google Scholar]
- Fotios S., Yang B., & Uttley J. (2015). Observing other pedestrians: Investigating the typical distance and duration of fixation. Lighting Research & Technology, 47, 548–564, doi: 10.1177/1477153514529299. [DOI] [Google Scholar]
- Foulsham T. & Sanderson L. A. (2013). Look who's talking? Sound changes gaze behaviour in a dynamic social scene. Visual Cognition, 21, 922–944, doi: 10.1080/13506285.2013.849785. [DOI] [Google Scholar]
- Foulsham T., Walker E., & Kingstone A. (2011). The where, what and when of gaze allocation in the lab and the natural environment. Vision Research, 51, 1920–1931, doi: 10.1016/j.visres.2011.07.002. [DOI] [PubMed] [Google Scholar]
- Gallup A. C., Chong A., & Couzin I. D. (2012). The directional flow of visual information transfer between pedestrians. Biology Letters, 8, 520–522, doi: 10.1037/0033-2909.133.4.694. [DOI] [PMC free article] [PubMed] [Google Scholar]
- Gallup A. C., Hale J. J., Sumpter D. J. T., Garnier S., Kacelnik A., Krebs J. R., & Couzin I. D. (2012). Visual attention and the acquisition of information in human crowds. Proceedings of the National Academy of Sciences, 109, 7245–7250, doi: 10.1073/pnas.1116141109. [DOI] [PMC free article] [PubMed] [Google Scholar]
- Gibson J. J. (1958). Visually controlled locomotion and visual orientation in animals. British Journal of Psychology, 49, 182–194. [DOI] [PubMed] [Google Scholar]
- Goffman E. (1966). Behavior in public places: Notes on the social organization of gatherings. New York, NY: The Free Press. [Google Scholar]
- Hayhoe M. (2000). Vision using routines: A functional account of vision. Visual Cognition, 7, 43–64, doi: 10.1080/135062800394676. [DOI] [Google Scholar]
- Hayhoe M. & Ballard D. (2005). Eye movements in natural behavior. Trends in Cognitive Sciences, 9, 188–194, doi: 10.1016/j.tics.2005.02.009. [DOI] [PubMed] [Google Scholar]
- Hayhoe M. & Ballard D. (2014). Modeling task control of eye movements. Current Biology, 24, R622–R628, doi: 10.1016/j.cub.2014.05.020. [DOI] [PMC free article] [PubMed] [Google Scholar]
- Hayhoe M. M. (2017). Vision and action. Annual Review of Vision Science, 3, 389–413. [DOI] [PubMed] [Google Scholar]
- Hessels R. S. (2020). How does gaze to faces support face-to-face interaction? A review and perspective. Psychonomic Bulletin & Review, doi: 10.3758/s13423-020-01715-w. [DOI] [PMC free article] [PubMed] [Google Scholar]
- Hessels R. S., Andersson R., Hooge I. T. C., Nyström M., & Kemner C. (2015). Consequences of eye color, positioning, and head movement for eye-tracking data quality in infant research. Infancy, 20, 601–633, doi: 10.1111/infa.12093. [DOI] [Google Scholar]
- Hessels R. S., Kemner C., van den Boomen C., & Hooge I. T. C. (2016). The area-of-interest problem in eyetracking research: A noise-robust solution for face and sparse stimuli. Behavior Research Methods, 48, 1694–1712, doi: 10.3758/s13428-015-0676-y. [DOI] [PMC free article] [PubMed] [Google Scholar]
- Hessels R. S., Benjamins J. S., Cornelissen T. H. W., & Hooge I. T. C. (2018). A validation of automatically-generated areas-of-interest in videos of a face for eye-tracking research. Frontiers in Psychology, 9, 1–8, doi: 10.3389/fpsyg.2018.01367. [DOI] [PMC free article] [PubMed] [Google Scholar]
- Hessels R. S., Holleman G. A., Cornelissen T. H. W., Hooge I. T. C., & Kemner C. (2018). Eye contact takes two—autistic and social anxiety traits predict gaze behavior in dyadic interaction. Journal of Experimental Psychopathology, pp. 1–17. [Google Scholar]
- Hessels R. S., Holleman G. A., Kingstone A., Hooge I. T. C., & Kemner C. (2019). Gaze allocation in face-to-face communication is affected primarily by task structure and social context, not stimulus-driven factors. Cognition, 184, 28–43, doi: 10.1016/j.cognition.2018.12.005. [DOI] [PubMed] [Google Scholar]
- Hessels R. S., van Doorn A. J., Benjamins J. S., Holleman G. A., & Hooge I. T. C. (2020). Task-related gaze control in human crowd navigation. Attention, Perception & Psychophysics, 82, 2482–2501, doi: 10.3758/s13414-019-01952-9. [DOI] [PMC free article] [PubMed] [Google Scholar]
- Ho S., Foulsham T., & Kingstone A. (2015). Speaking and listening with the eyes: Gaze signaling during dyadic interactions. PLoS One, 10, e0136905, doi: 10.1371/journal.pone.0136905.s001. [DOI] [PMC free article] [PubMed] [Google Scholar]
- Holleman G. A., Hessels R. S., Kemner C., & Hooge I. T. C. (2020). Implying social interaction and its influence on gaze behavior to the eyes. PLoS ONE, 15(2), e0229203, doi: 10.1371/journal.pone.0229203. [DOI] [PMC free article] [PubMed] [Google Scholar]
- Hooge I. T. C., Niehorster D. C., Nyström M., Andersson R., & Hessels R. S. (2018). Is human classification by experienced untrained observers a gold standard in fixation detection? Behavior Research Methods, 50, 1864–1881, doi: 10.3758/s13428-017-0955-x. [DOI] [PMC free article] [PubMed] [Google Scholar]
- Jovancevic-Misic J. & Hayhoe M. (2009). Adaptive gaze control in natural environments. Journal of Neuroscience, 29, 6234–6238, doi: 10.1523/JNEUROSCI.5570-08.2009. [DOI] [PMC free article] [PubMed] [Google Scholar]
- Kanan C., Bseiso D. N. F., Ray N. A., Hsiao J. H., & Cottrell G. W. (2015). Humans have idiosyncratic and task-specific scanpaths for judging faces. Vision Research, 108, 67–76, doi: 10.1016/j.visres.2015.01.013. [DOI] [PubMed] [Google Scholar]
- Kingstone A. (2009). Taking a real look at social attention. Current Opinion in Neurobiology, 19, 52–56, doi: 10.1016/j.conb.2009.05.004. [DOI] [PubMed] [Google Scholar]
- Kitazawa K. & Fujiyama T. (2010). Pedestrian vision and collision avoidance behavior: Investigation of the information process space of pedestrians using an eye tracker. In Klingsch W. W. F., Rogsch C., Schadschneider A., & Schreckenberg M. (Eds.). Pedestrian and Evacuation Dynamics 2008 (pp. 95–108). Berlin, Germany: Springer. [Google Scholar]
- Kleinke C. L. (1986). Gaze and eye contact: A research review. Psychological Bulletin, 100, 78–100. [PubMed] [Google Scholar]
- Laidlaw K. E. W., Foulsham T., Kuhn G., & Kingstone A. (2011). Potential social interactions are important to social attention. Proceedings of the National Academy of Sciences, 108, 5548–5553, doi: 10.1073/pnas.1017022108. [DOI] [PMC free article] [PubMed] [Google Scholar]
- Land M., Mennie N., & Rusted J. (1999). The roles of vision and eye movements in the control of activities of daily living. Perception, 28, 1311–1328, doi: 10.1068/p2935. [DOI] [PubMed] [Google Scholar]
- Land M. F. & Furneaux S. (1997). The knowledge base of the oculomotor system. Philosophical Transactions of the Royal Society B: Biological Sciences, 352, 1231–1239. [DOI] [PMC free article] [PubMed] [Google Scholar]
- Meerhoff L. A., Bruneau J., Vu A., Olivier A. H., & Pettré J. (2018). Guided by gaze: Prioritization strategy when navigating through a virtual crowd can be assessed through gaze activity. Acta Psychologica, 190, 248–257, doi: 10.1016/j.actpsy.2018.07.009. [DOI] [PubMed] [Google Scholar]
- Mehoudar E., Arizpe J., Baker C. I., & Yovel G. (2014). Faces in the eye of the beholder: Unique and stable eye scanning patterns of individual observers. Journal of Vision, 14(7), 1–11, doi: 10.1167/14.7.6. [DOI] [PMC free article] [PubMed] [Google Scholar]
- Mihoub A., Bailly G., Wolf C., & Elisei F. (2015). Learning multimodal behavioral models for face-to-face social interaction. Journal on Multimodal User Interfaces, 9, 195–210, doi: 10.1007/s12193-015-0190-7. [DOI] [Google Scholar]
- Moussaïd M., Helbing D., & Theraulaz G. (2011). How simple rules determine pedestrian behavior and crowd disasters. Proceedings of the National Academy of Sciences, 108, 6884–6888, doi: 10.1073/pnas.1016507108/-/DCSupplemental. [DOI] [PMC free article] [PubMed] [Google Scholar]
- Niehorster D. C., Hessels R. S., & Benjamins J. S. (2020). GlassesViewer: Open-source software for viewing and analyzing data from the Tobii Pro Glasses 2 eye tracker. Behavior Research Methods, 52, 1244–1253, doi: 10.3758/s13428-019-01314-1. [DOI] [PMC free article] [PubMed] [Google Scholar]
- Niehorster D. C., Santini T., Hessels R. S., Hooge I. T. C., Kasneci E., & Nyström M. (2020). The impact of slippage on the data quality of head-worn eye trackers. Behavior Research Methods, 52, 1140–1160, doi: 10.3758/s13428-019-01307-0. [DOI] [PMC free article] [PubMed] [Google Scholar]
- Peterson M. F. & Eckstein M. P. (2013). Individual differences in eye movements during face identification reflect observer-specific optimal points of fixation. Psychological Science, 24, 1216–1225, doi: 10.1177/0956797612471684. [DOI] [PMC free article] [PubMed] [Google Scholar]
- Peterson M. F., Lin J., Zaun I., & Kanwisher N. (2016). Individual differences in face-looking behavior generalize from the lab to the world. Journal of Vision, 16(7), 12–18, doi: 10.1167/16.7.12. [DOI] [PubMed] [Google Scholar]
- Risko E. F., Richardson D. C., & Kingstone A. (2016). Breaking the fourth wall of cognitive science. Current Directions in Psychological Science, 25, 70–74, doi: 10.1177/0963721415617806. [DOI] [Google Scholar]
- Rösler L., Göhring S., Strunz M., & Gamer M. (2020). Social anxiety is associated with alterations in heart rate but not gaze in a real social interaction, doi: 10.31234/osf.io/gps3h. [DOI] [PMC free article] [PubMed]
- Rousselet G. A., Pernet C. R., & Wilcox R. R. (2017). Beyond differences in means: Robust graphical methods to compare two groups in neuroscience. European Journal of Neuroscience, 46, 1738–1748, doi: 10.1111/ejn.13610. [DOI] [PubMed] [Google Scholar]
- Rubo M., Huestegge L., & Gamer M. (2020). Social anxiety modulates visual exploration in real life—but not in the laboratory. British Journal of Psychology, 111, 233–245, doi: 10.1111/bjop.12396. [DOI] [PMC free article] [PubMed] [Google Scholar]
- Ruhland K., Peters C. E., Andrist S., Badler J. B., Badler N. I., Gleicher M., Mutlu B., & McDonnell R. (2015). A review of eye gaze in virtual agents, social robotics and HCI: Behaviour generation, user interaction and perception. Computer Graphics Forum, 34, 299–326, doi: 10.1111/cgf.12603.27540272 [DOI] [Google Scholar]
- Scott H., Batten J. P., & Kuhn G. (2019). Why are you looking at me? It's because I'm talking, but mostly because I'm staring or not doing much. Attention, Perception & Psychophysics, 81, 109–118, doi: 10.3758/s13414-018-1588-6. [DOI] [PMC free article] [PubMed] [Google Scholar]
- Skantze G., Hjalmarsson A., & Oertel C. (2014). Turn-taking, feedback and joint attention in situated human-robot interaction. Speech Communication, 65, 50–66, doi: 10.1016/j.specom.2014.05.005. [DOI] [Google Scholar]
- van Leeuwen J., Smeets J. B. J., & Belopolsky A. V. (2019). Forget binning and get SMART: Getting more out of the time-course of response data. Attention, Perception, & Psychophysics, 81, 2956–2967, doi: 10.3758/s13414-019-01788-3. [DOI] [PMC free article] [PubMed] [Google Scholar]
- Võ M. L. H., Smith T. J., Mital P. K., & Henderson J. M. (2012). Do the eyes really have it? Dynamic allocation of attention when viewing moving faces. Journal of Vision, 12(13), 1–14, doi: 10.1167/12.13.3. [DOI] [PubMed] [Google Scholar]
- Warren W. H. (2018). Collective motion in human crowds. Current Directions in Psychological Science, 27, 232–240, doi: 10.1177/0963721417746743. [DOI] [PMC free article] [PubMed] [Google Scholar]
- Warren W. H., Jr. (1998). Visually controlled locomotion: 40 years later. Ecological Psychology, 10, 177–219, doi: 10.1080/10407413.1998.9652682. [DOI] [Google Scholar]
- Yarbus A. L. (1967). Eye movements and vision. New York, NY: Plenum Press. doi: 10.1007/978-1-4899-5379-7. [DOI] [Google Scholar]
Associated Data
This section collects any data citations, data availability statements, or supplementary materials included in this article.
Data Availability Statement
OpenPose and eye-tracking data are available from the authors upon reasonable request. Due to privacy regulations, videos recorded using the Tobii Pro Glasses 2 cannot be made available.