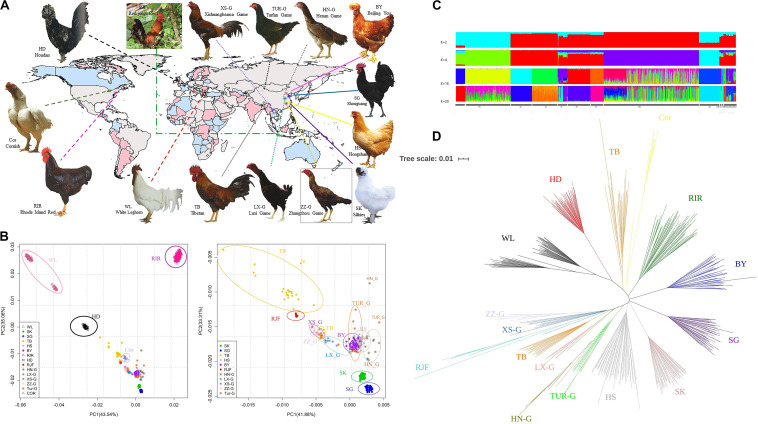
FIGURE 1.
(A) Chicken breeds with distinct phenotypes and geographical information (Photos came from poultry genetic resources in china). (B) Principal component analysis revealing genetic differentiation of 15 populations using SNP data. Breeds which are labeled, their names are mentioned in the main text; The Commercial breeds are denoted by triangle symbols, The Chinese indigenous breeds are displayed as dots, RJFs are displayed as plus sign, Europe local breed is denoted by squares, and the rest populations are marked as asterisks; PCA was performed on the whole population, plotting the first and the second dimension revealed PCA of 15 populations. (C) The admixture plot for breeds analyzed based on different number of assumed ancestors (K). (D) Neighbor-joining tree constructed using PHYLIP.

