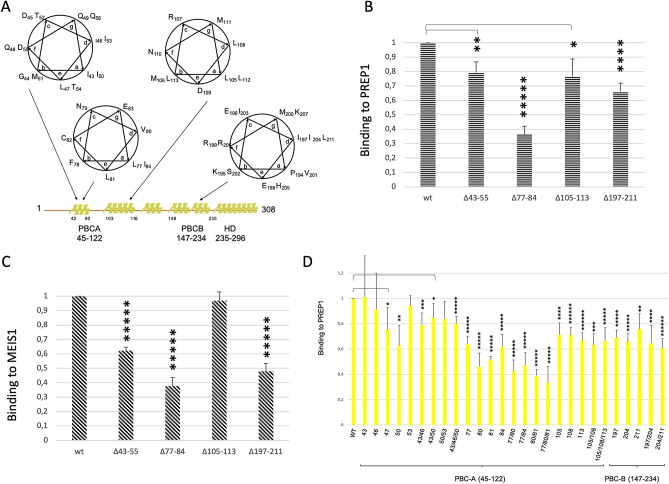
Figure 3.
Characterization of PBX1 mutants. Panel A: Mapping of the heptad repeats of PBX1within PBC-A and PBC-B. Predicted alpha-helical regions are represented as yellow areas above the linear sequence. Boundaries of PBC-A, PBC-B and homeodomain are defined below the linearized sequence. Panel B: Time-resolved fluorescence immunoassay (TR-FIA)-measured binding of wild-type and mutant PBX1 to wild-type PREP1. The Y axis reports the binding to PREP1 of the PBX1 deletion mutants, normalized for the binding of wild-type PBX1 taken as 1. The results represent the average of three independent assays, + /− the standard deviation. The extent of deletions is indicated below the ordinates bar. Panel C: TR-FIA-measured binding of wild-type and mutant PBX1 to wild-type MEIS1. The Y axis reports the binding to MEIS1 of the PBX1 deletion mutants, normalized for the binding of wild-type PBX1 taken as 1. The results represent the average of three independent assays, + /− standard deviation. Panel D: TR-FIA-measured binding of wild-type and point mutants of PBX1 to wild-type PREP1. Single and multiple mutations analysed are indicated below the bars. PBC-A and PBC-B are mapped below the ordinates bar. The Y axis reports the binding to PREP1 of the PBX1 mutants, normalized for the binding of wild-type PBX1 taken as 1. The results represent the average of four independent assays, + /− the standard deviation. T-TEST was performed as described in the Methods section.

