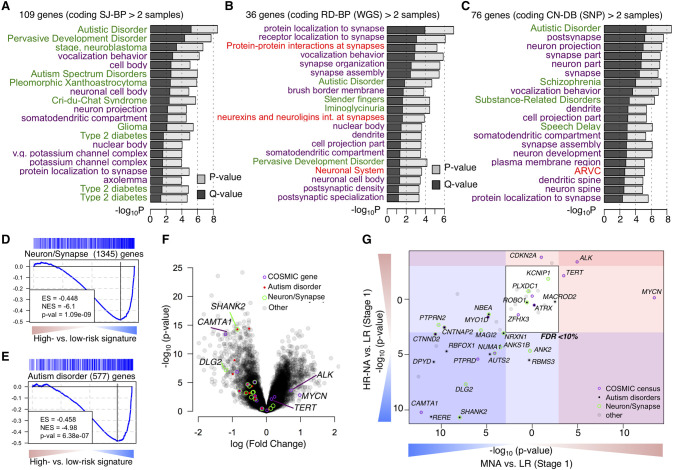
Figure 4.
Neurodevelopmental genes are recurrently targeted by structural variations in neuroblastoma. (A–C) Function enrichment analysis bar plots for genes recurrently altered based on breakpoint analyses: (A) SJ-BPs; (B) RD-BPs; (C) CN-BPs. Analysis includes gene sets associated with diseases (green), Gene Ontology (purple), and Pathways (red). (D,E) Gene Set Enrichment Analysis across the signature of high- versus low-risk tumors from the HumanExon array show enrichment of neuronal and synapse part (D) and autism disorder predisposition genes (E). (F) Volcano plot showing differential expression between high- and low-risk highlighting genes with recurrent SVs and their functional classification. (G) Subtype-specific high- versus low-risk differential expression analysis of 77 recurrently altered genes from Figure 3I shown as scatter plot: (MNA) x-axis; (HR-NA) y-axis). (D–G) Analysis was replicated in two data sets: HuEx arrays (here) and RNA-seq (Supplemental Fig. S21A–D).

