Figure 6.
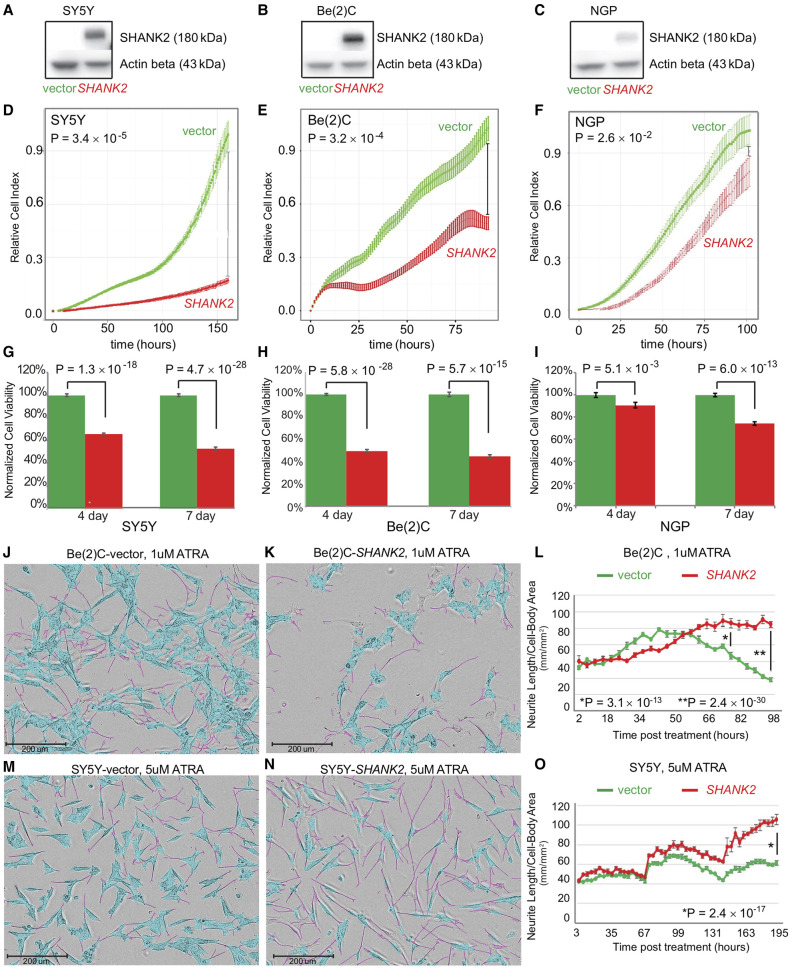
SHANK2 reduces cell growth and promotes differentiation in neuroblastoma cell line models. (A–C) Western blots confirming overexpression of SHANK2 in all tested neuroblastoma cells: (A) SY5Y, (B) Be(2)C, (C) NGP. (D–F) Decreased proliferation in all three lines overexpressing SHANK2 (red) compared to controls (green), as measured by RT-CES. (G–I) Decreased viability in SHANK2 overexpressing cells (red) versus controls (green) as measured by ATP-dependent CellTiter-Glo Assay. (J,K) IncuCyte images of Be(2)C cells for vector control (J) and SHANK2-expressing cells (K) at 78 h post treatment with 1 µM ATRA. Neurite extensions masked in pink; cell bodies masked in blue. (L) Neurite length normalized to cell body area starting immediately after ATRA application corresponding to Be(2)C cells images at different time points. (M,N) SY5Y images from IncuCyte at day nine post ATRA treatment (5 µM). (O) Neurite outgrowth normalized to cell body area in corresponding to SY5Y cells images at different time points.

