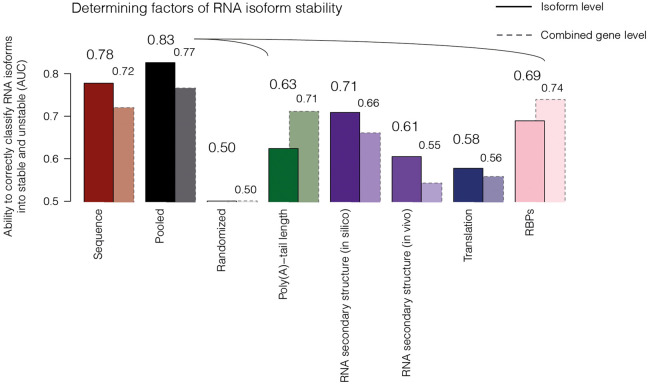
Figure 3.
Determining factors of RNA isoform stability. Bar plot showing RNA stability related features (x-axis), namely, sequence (red), poly(A)-tail length (green), RNA secondary structure in silico or in vivo (violet), translation efficiency (dark blue), and RNA-binding proteins (RBPs; pink), and their abilities to correctly classify RNA isoforms into stable (above median half-life) or unstable (below median half-life) species (AUC; y-axis) (Methods; Supplemental Tables S4, S6). In black, all pooled features (listed above, excluding sequence and randomization) are represented (pooled). Bars with solid lines depict the features on RNA isoform level. Bars with dashed borders represent (AUC) of features calculated on combined RNA signal (gene level; all RNAs encoded by the entire gene loci regardless of isoform assignment).

