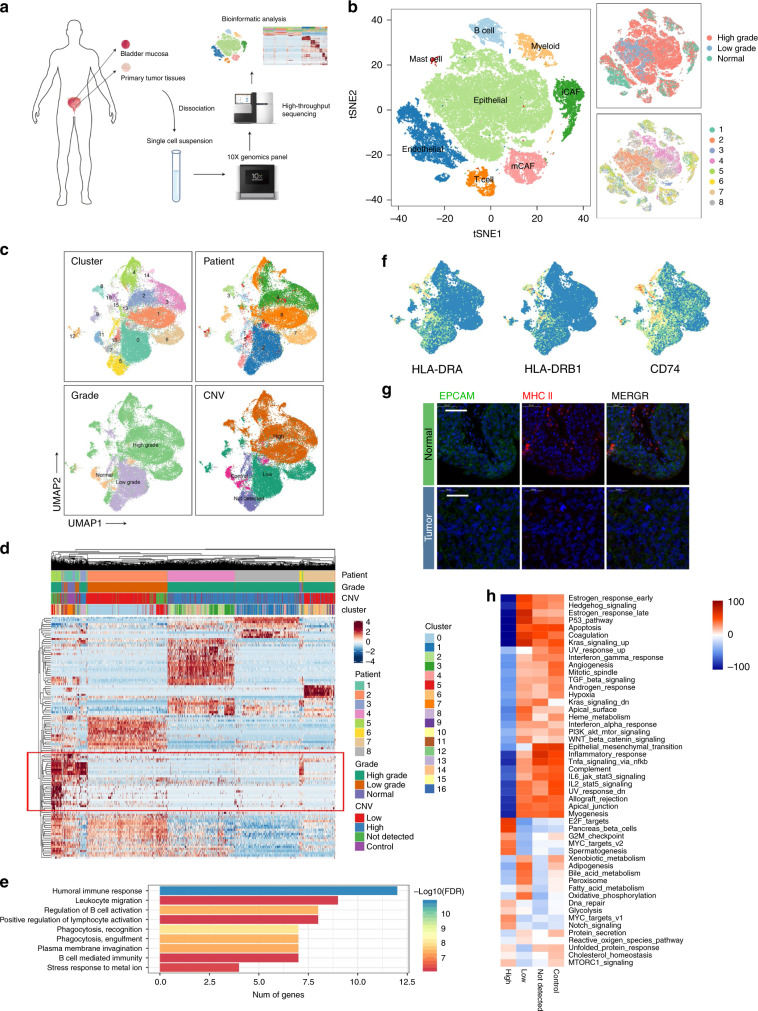
Fig. 1. Identifying infiltrated cell types in BC and non-malignant tissues.
a, b Identifying infiltrated cell types in BC and non-malignant tissues. a Workflow of the sample preparation, sequencing and bioinformatic analysis. b tSNE plot of single cells profiled in the presenting work colored by major cell types, tumor grade and patient. c–h Reclustering of EPCAM+ cells. c UMAP plot EPCAM+ cells (epithelial marker) colored by cluster, patient, grade and CNV level. d Heatmap of differentially expressed genes (DEGs) of every CNV group. e Enriched GO functions of downregulated genes in malignant cells. f Expression levels of MHC-II molecules and CD74. g Immunofluorescence (IF) staining of MHC-II molecules and EPCAM. Scale bar represents 50 μm. h Heatmap shows difference in pathway activities scored by GSVA per cell between different CNV groups. Shown are t-values from a lineal model.

