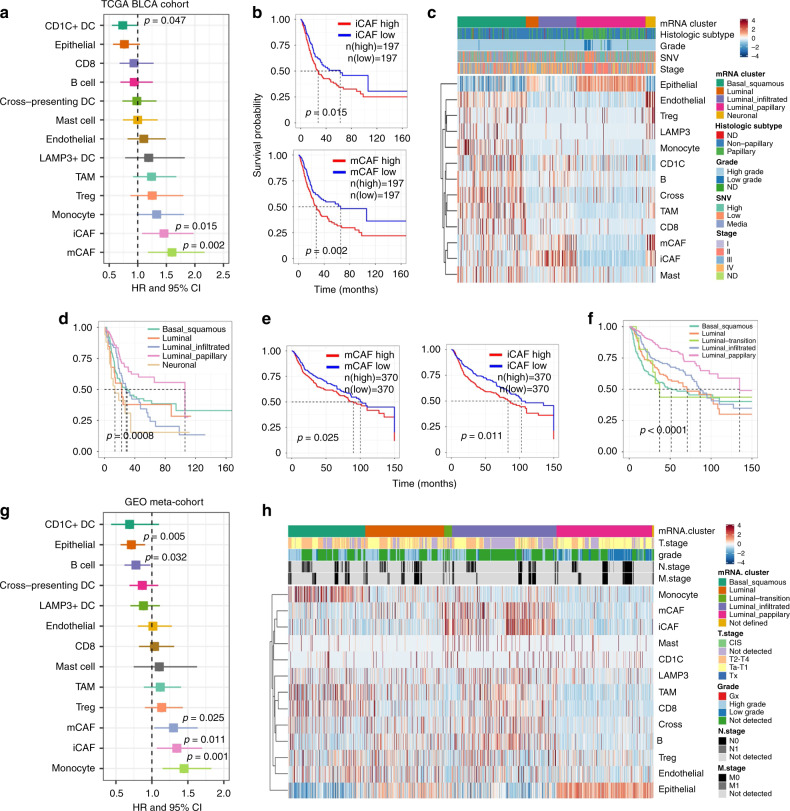
Fig. 5. Molecular subtypes of BC were caused by heterogeneity of TME.
a Association between relative cell abundance and patient survival from TCGA BLCA cohort (COX regression analysis). b Kaplan–Meier curves for TCGA BLCA patients. P value was calculated with log-rank test. c Heatmap of cell abundance predicted per sample from TCGA BLCA cohort by CIBERSORTx. Shown are row z-score. d Kaplan–Meier survival curve for TCGA BLCA patients, grouped by molecular subtypes. e Kaplan–Meier survival curves for microarray-based meta-cohort patients. f Kaplan–Meier survival curve for microarray-based meta-cohort patients, grouped by molecular subtypes. P values of (d–f) were calculated with log-rank test. g Association between relative cell abundance and patient survival from microarray-based meta-cohort (COX regression). h Heatmap of cell abundance predicted per sample from microarray-based meta-cohort by CIBERSORTx. Shown are row z-score.

