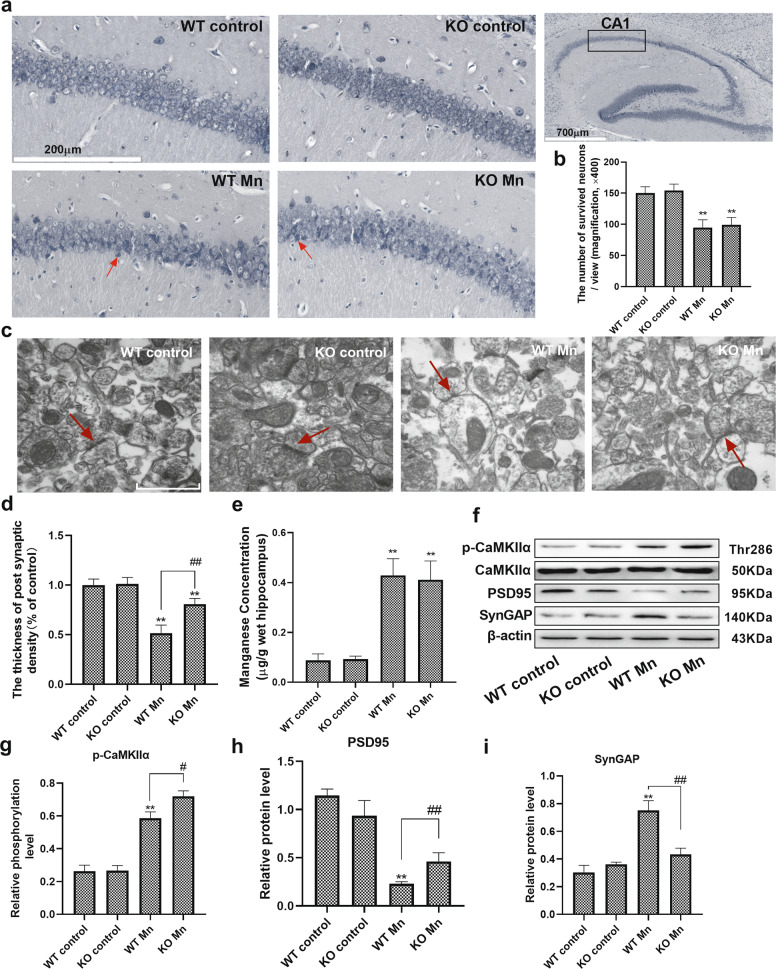
Fig. 2. Mn induces synaptic degeneration in WT and α-Syn KO mice.
a, b Representative Nissl staining of the hippocampal CA1 region indicated by the black frame, and the injured neurons are indicated by the red arrows in Mn-treated mice. Bars = 200 μm. c Representative transmission electron microscopy image of the synapse ultrastructure. The red arrows indicate the postsynaptic density. Scale bars = 500 nm. d Electron microscopy images were quantitated and analyzed by ImageJ. e The total levels of manganese were evaluated in the hippocampal region. f–i The levels of postsynaptic proteins (PSD95, CaMKIIα, and SynGAP) and phosphorylated CaMKIIα were measured by western blotting. n = 6. **P < 0.01, and *P < 0.05 compared to controls; # #P < 0.01, and #P < 0.05 for comparison between the Mn-treated WT mice.

