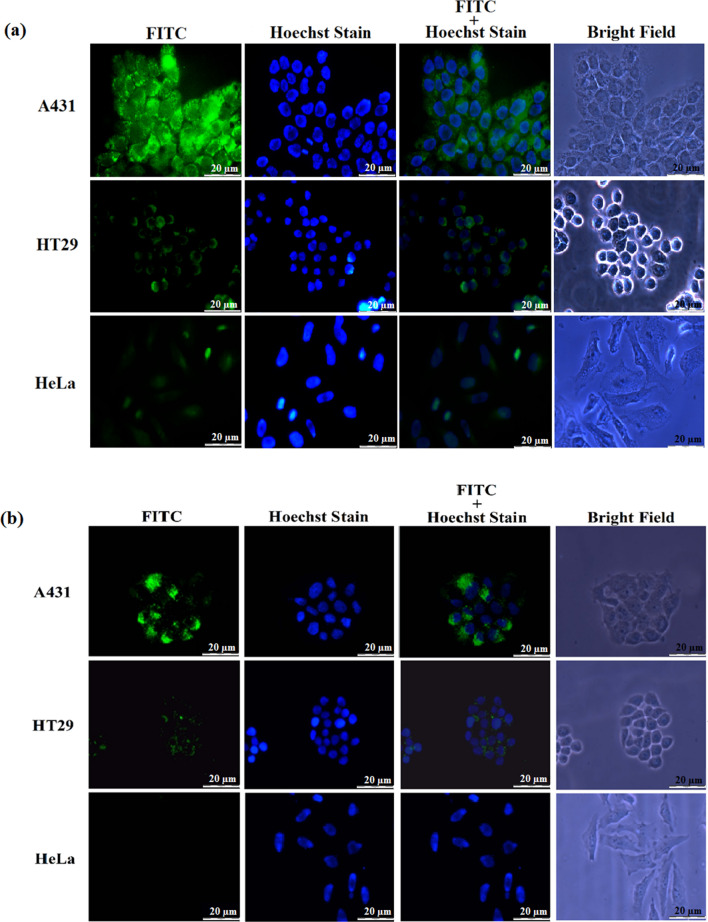
Figure 1.
Analysis of EGFR expression via immunofluorescence microscopy, and internalization of CPP-FITC into A431, HT29 and HeLa cells expressing different levels of EGFR. (a) A431, HT 29 and HeLa cells were incubated with the rabbit anti-EGFR monoclonal antibody for 2 h at RT, followed by incubation with the goat anti-rabbit IgG conjugated to FITC for 1 h at RT to detect the expression of EGFR in the three cell lines. A431 cells exhibited the highest fluorescent intensity followed by HT29 cells, and HeLa cells showed the lowest fluorescent intensity. (b) Peptide NRPDSAQFWLHH conjugated with FITC (CPP-FITC; 0.25 mM) was added onto A431, HT29 and HeLa cells, incubated for 16 h at 37 °C, and observed under a fluorescence microscope. A431 cells that express the highest level of EGFR exhibited an intense fluorescence as compared to HT29 cells, which have intermediate amount of EGFR. The fluorescent signal was negligible in HeLa cells, which have the lowest number of EGFR/cell.

