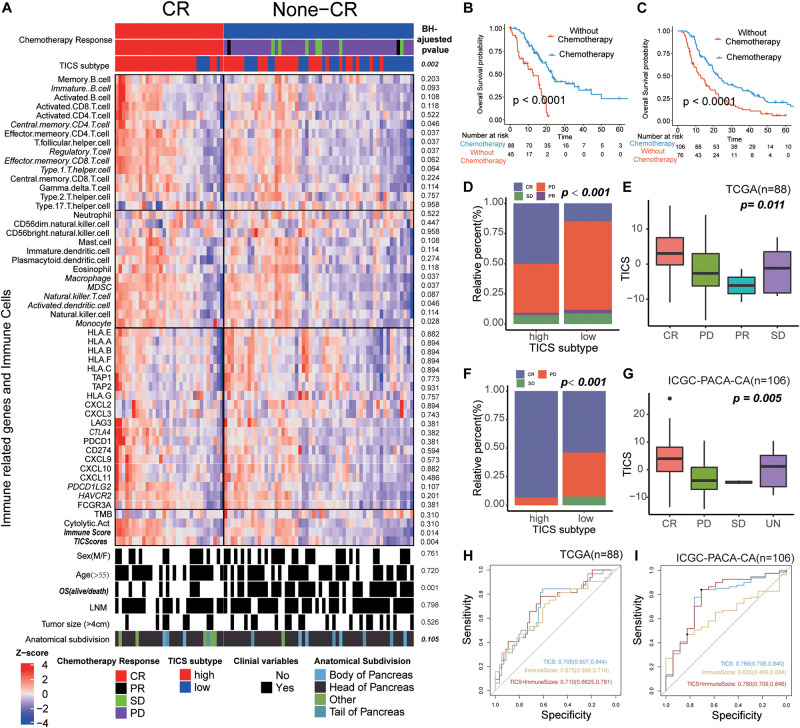
FIGURE 6.
The Utilization of TICS for Chemosensitivity Prediction. These figures refer to the TCGA (n = 88) and ICGC-PACA-CA cohorts (n = 106). (A) Heatmap of the immune cells and immune related genes between the patients with status CR and non-CR after chemotherapy. (B,C) Survival analysis for patients with and without chemotherapy in TCGA and ICGC cohorts, respectively. (D,E) Bar and box plot for the relationship between TICS and chemosensitivity in the TCGA cohort. Complete Response (CR), Partial Response (PR), Stable Disease (SD) and Progressive Disease (PD). (F,G) Bar and box plot for the relationship between TICS and chemosensitivity in the ICGC-PACA-CA cohort. (H,I) ROC analysis of TICS and the combination with other immune-related genes for predicting the complete response status in both cohorts.

