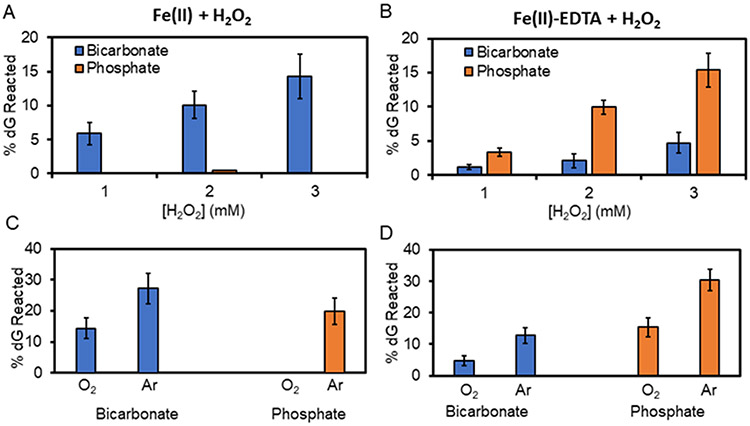
Fig 1.
Percent dG oxidized by the iron-Fenton reaction in bicarbonate (blue) or phosphate (orange) buffer. The top panels plot [H2O2] dependency for the (A) Fe(II) or (B) Fe(II)-EDTA initiated reactions and the bottom panels illustrates the O2 dependency for the (C) Fe(II) or (D) Fe(II)-EDTA initiated reactions.

