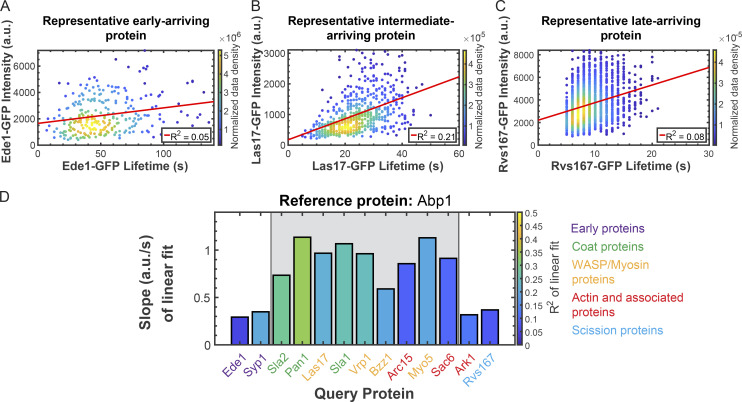
Figure 3.
Lifetime and maximum intensity are positively correlated for individual later-arriving CME proteins, but are less correlated for earlier-arriving proteins. (A–C) Scatter plots of maximum intensity vs. lifetime for Ede1-GFP (A), Las17-GFP (B), and Rvs167-GFP (C). Color indicates the normalized data density in the neighborhood around each point. Red lines are linear fits to the data with the indicated R2 values. (D) Summary of linear fits to plots of maximum intensity vs. lifetime for the indicated GFP-tagged query proteins. The bar height and color indicate the normalized slope and the R2 of the fit, respectively. The grayed area highlights proteins displaying similar behavior. Colored text indicates which module each protein imaged belongs to according to the color scheme at right. Association of query protein signal with signal of the reference protein Abp1-RFP was used to eliminate spurious events. See Fig. S1 for all related scatter plots.

