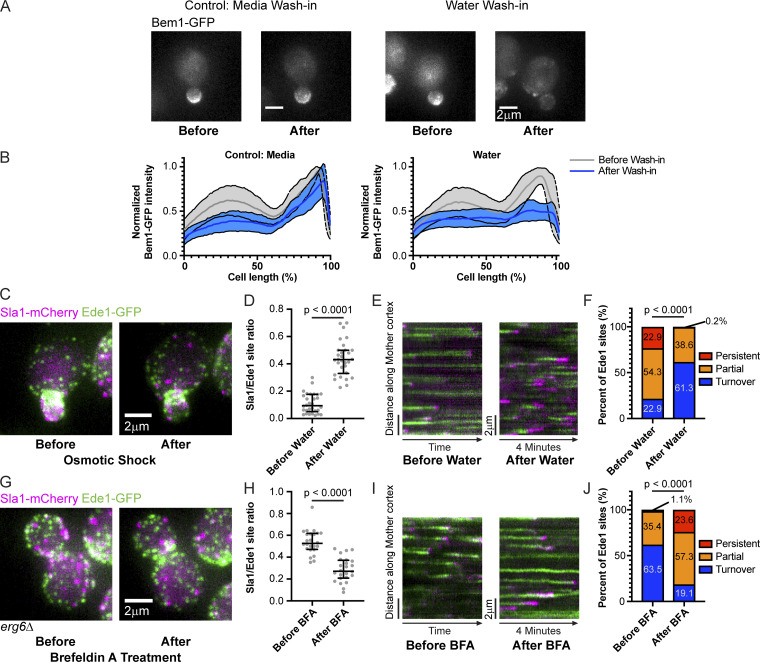
Figure 8.
Endocytic site maturation rate is controlled by polarized cargo deposition. (A) Maximum-intensity projections of cells endogenously expressing polarity marker Bem1-GFP before and 5 min after 17-fold dilution into isotonic imaging media (control, left) or water (right). (B) Average ± SD for Bem1-GFP intensity profiles from 20 (media, left) and 30 (water, right) cells before and after dilution into the indicated media. Individual intensity profiles generated from 25-pixel-wide lines were normalized to the maximum value before dilution and to cell length. (C) Maximum-intensity projections of a cell endogenously expressing Sla1-mCherry (magenta) and Ede1-GFP (green) before and 5 min after 17-fold dilution into water. (D) Quantification of the ratio of the number of Sla1-mCherry sites to Ede1-GFP sites from maximum-intensity projections of z-stacks of 30 small-budded mother cells before and after osmotic shock. A two-tailed P value from a Mann–Whitney U test as in Fig. 7 C (U = 7) is displayed. The median and interquartile ranges are denoted with error bars. (E) Circumferential kymographs around the mother cortex from medial focal plane videos of cells endogenously expressing Sla1-mCherry (magenta) and Ede1-GFP (green) before and 5 min after 17-fold dilution into water. (F) Percentage of 280 Ede1 patches from 30 small-budded mother cells before and 594 Ede1 patches from 30 small-budded mother cells after osmotic shock that persist, are partially captured, or turn over during a 4-min video as in Fig. 7 D. A two-tailed P value from a chi-square test as in Fig. 7 D (chi-square = 543.1, 2 degrees of freedom) is displayed. (G) Maximum-intensity projections of an erg6Δ cell endogenously expressing Sla1-mCherry (magenta) and Ede1-GFP (green) before and 10 min after treatment with BFA. (H) Quantification of the ratio of the number of Sla1-mCherry sites to Ede1-GFP sites from maximum-intensity projections of z-stacks of 24 large-budded, erg6Δ mother cells before and after BFA treatment. A two-tailed P value from a Mann–Whitney U test as in Fig. 7 C (U = 25.5) is displayed. The median and interquartile ranges are denoted with error bars. (I) Circumferential kymographs around the mother cortex from medial focal plane videos of erg6Δ cells endogenously expressing Sla1-mCherry (magenta) and Ede1-GFP (green) before and 10 min after treatment with BFA. (J) Percentage of 277 Ede1 patches from 18 large-budded erg6Δ mother cells before and 266 Ede1 patches from 22 large-budded erg6Δ mother cells after BFA treatment that persist, are partially captured, or turn over during a 4-min video as in Fig. 7 D. A two-tailed P value from a chi-square test as in Fig. 7 D (chi-square = 1,122, 2 degrees of freedom) is displayed.

