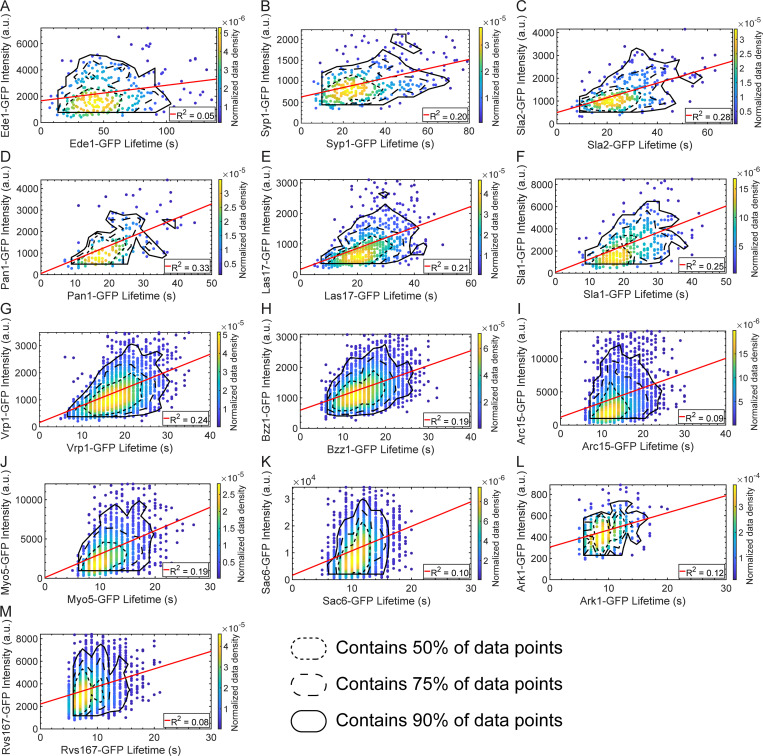
Figure S1.
Maximum intensity vs. lifetime plots for GFP-tagged query proteins. Scatter plots of query protein maximum intensity vs. lifetime for GFP-tagged Ede1 (A), Syp1 (B), Sla2 (C), Pan1 (D), Las17 (E), Sla1 (F), Vrp1 (G), Bzz1 (H), Arc15 (I), Myo5 (J), Sac6 (K), Ark1 (L), and Rvs167 (M). Color indicates the normalized data density in the neighborhood around each point. Red lines are linear fits to the data with the indicated R2 value. Association of query protein signal with signal of the reference protein Abp1-RFP was used to eliminate spurious events. Contour lines encompassing ∼50% (short-dashed line), 75% (long-dashed line), and 90% (solid line) encircle local maxima of a 10-bin by 10-bin histogram of the data.

