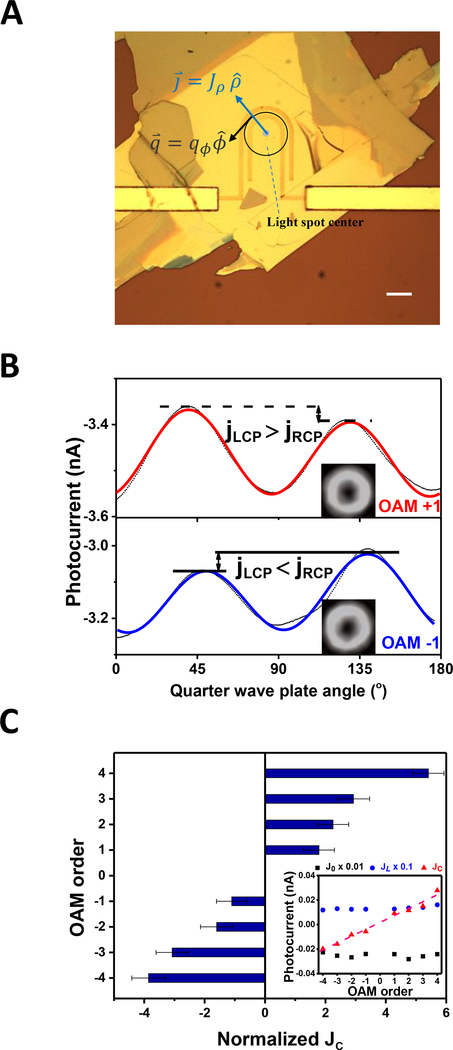
Figure 2: Evidence of the nonlocal photocurrent generated by OAM of light and its dependence on OAM order.
(A) Optical image of a photodetector device with ‘U’-shaped electrodes on WTe2. The light spot is focused at the center of the arc defined by the electrodes (blue circle).. Scale bar: 10 μm. (B) Measured photocurrent amplitudes from OAM +1 (red curve) and −1 (blue curve) beams, as a function of the QWP angle (α). The insets are CCD images of OAM +1 and −1 beams. (C) Normalized photocurrent that switches with circular polarization, from beams with OAM order ranging from −4 to 4. Error bars represent the standard deviations of the fitting. (Inset) Three components of the measured photocurrent: J0, JL and JC.

