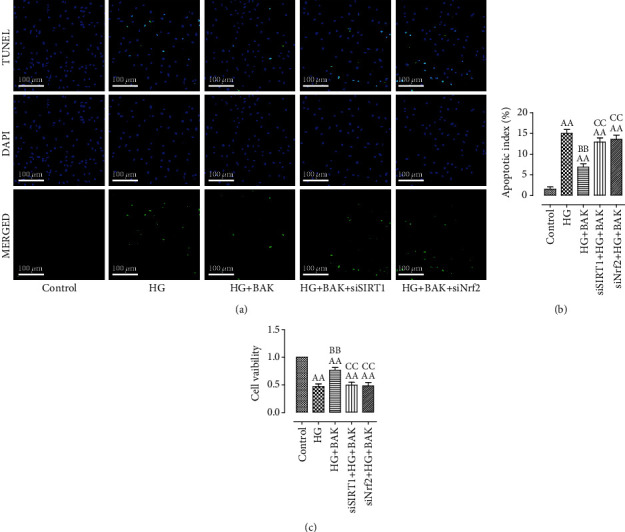
Figure 10.

SIRT1 siRNA and Nrf2 siRNA transfection blunted BAK-induced antiapoptotic effect in HG-treated H9c2 cells. (a) Representative images of TUNEL staining (scale bar = 100 μm). The apoptotic cells were detected by TUNEL (green), and the nuclei were detected by DAPI (blue). (b) Cellular apoptotic index. (c) Cell viability. Data are presented as the mean ± SEM (n = 6 in each group). aaP < 0.01 vs. the control group, bbP < 0.01 vs. the HG group, and ccP < 0.01 vs. the HG+BAK group.
