
Figure 11.
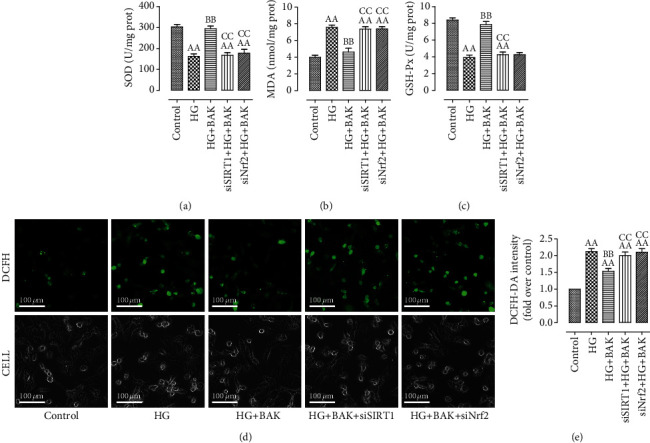
SIRT1 siRNA and Nrf2 siRNA transfection inhibited BAK-induced suppression on oxidative stress in HG-treated H9c2 cells. (a) Intracellular SOD activity. (b) Intracellular MDA content. (c) Intracellular GSH-Px activity. (d) Representative images of DCFH-DA staining (scale bar = 100 μm). (e) DCFH-DA intensity. Data are presented as the mean ± SEM (n = 6 in each group). aaP < 0.01 vs. the control group, bbP < 0.01 vs. the HG group, and ccP < 0.01 vs. the HG+BAK group.