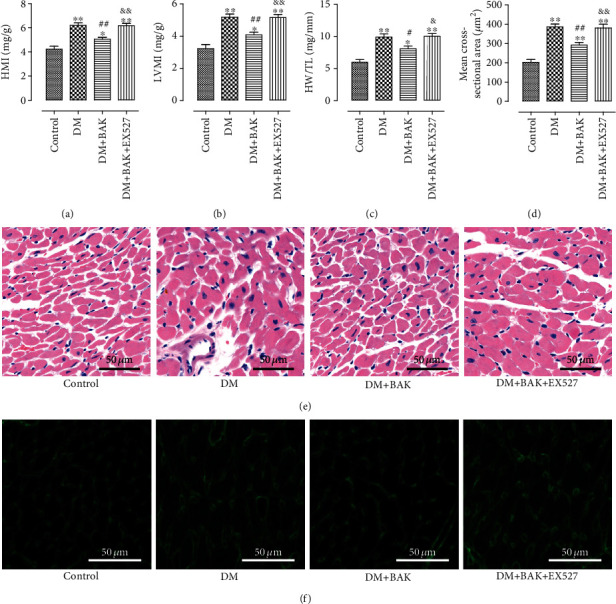
Figure 3.

EX527 blocked BAK-induced mitigation of cardiac hypertrophy in diabetic mice. (a) Heart mass index (HMI). (b) Left ventricular mass index (LVMI). (c) Heart weight/tibia length (HW/TL) ratio. (d) Mean cross-sectional area of individual cardiomyocyte. (e) Representative images of HE staining of myocardial tissue (scale bar = 50 μm). (f) Representative images of WGA staining of myocardial tissue (scale bar = 50 μm). Data are presented as the mean ± SEM (n = 6 in each group). ∗/∗∗P < 0.05/0.01 vs. the control group, #/##P < 0.05/0.01 vs. the DM group, and &/&&P < 0.05/0.01 vs. the DM+BAK group.
