
Figure 4.
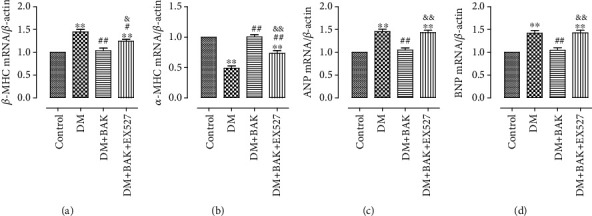
EX527 blunted BAK-induced suppression on activation of hypertrophy-related genes in diabetic myocardium. (a) β-MHC mRNA level. (b) α-MHC mRNA level. (c) ANP mRNA level (8W). (d) BNP mRNA level. Data are presented as the mean ± SEM (n = 6 in each group). ∗/∗∗P < 0.05/0.01 vs. the control group, #/##P < 0.05/0.01 vs. the DM group, and &/&&P < 0.05/0.01 vs. the DM+BAK group.