
Figure 5.
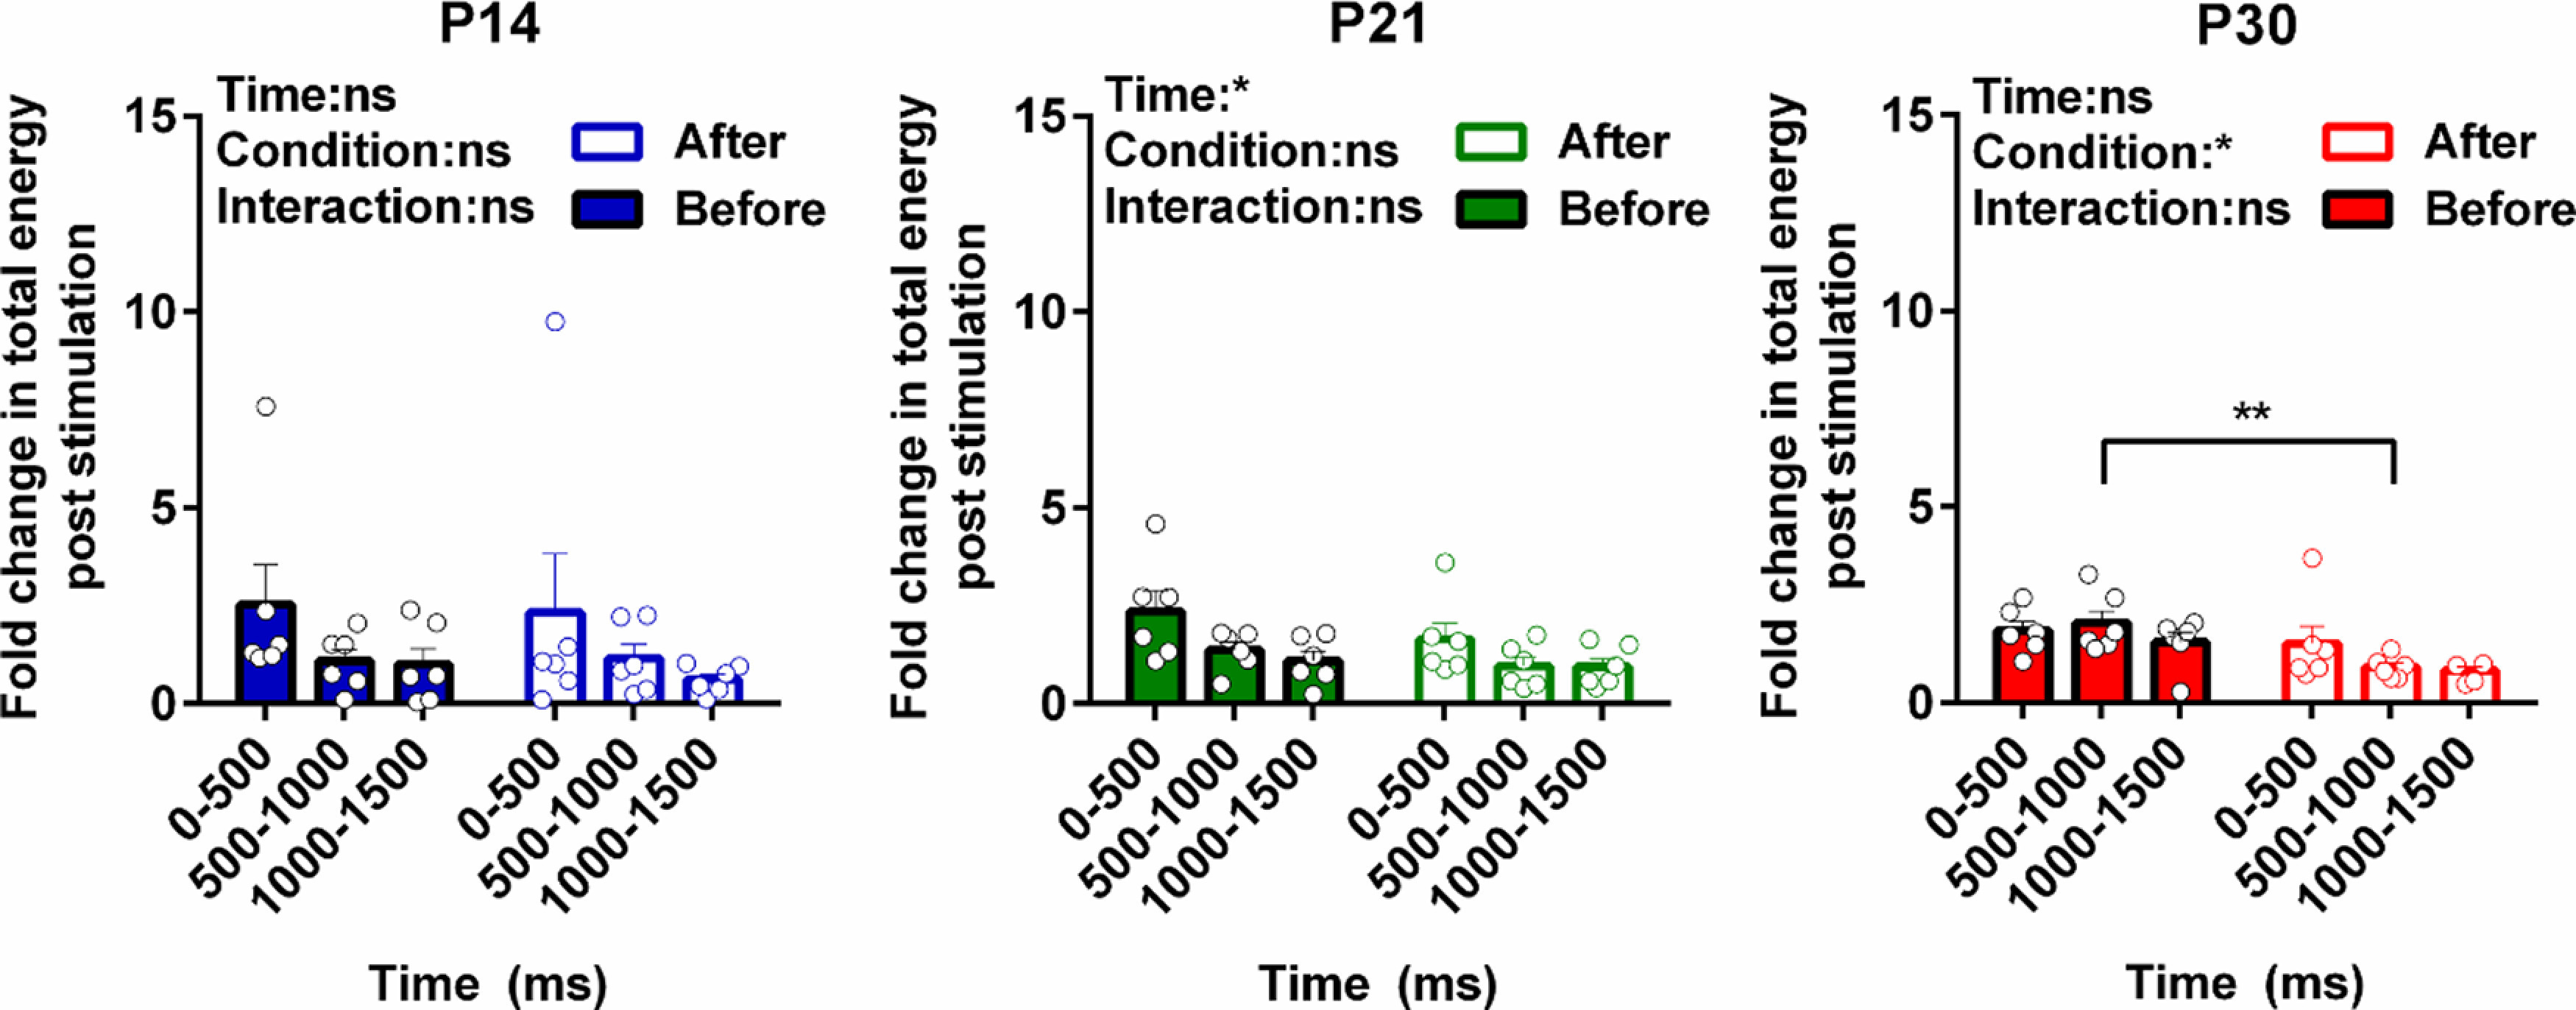
Developmental regulation of total energy changes in S1 neuronal oscillations following C fiber silencing. Total energy changes evoked by A + C fiber (500 μs) electrical stimulation of the contralateral hindpaw at P14, P21, and P30 between 0 and 500, 500 and 1000, and 1000 and 1500 ms poststimulation before and after silencing C fibers input. Mean (±SEM) total energy changes (compared with baseline) to electrical stimuli (10 stimuli at 10-s ISI, 3.2 mA, n = 6 rats at each age). Each dot represents the average across stimuli for each rat. Statistical analysis was performed using two-way RM ANOVA (summary result is shown on top left of each panel) with Sidak’s multiple comparisons test (significant between groups were indicated by brackets); *p < 0.05, **p < 0.01, and ns: not significant.