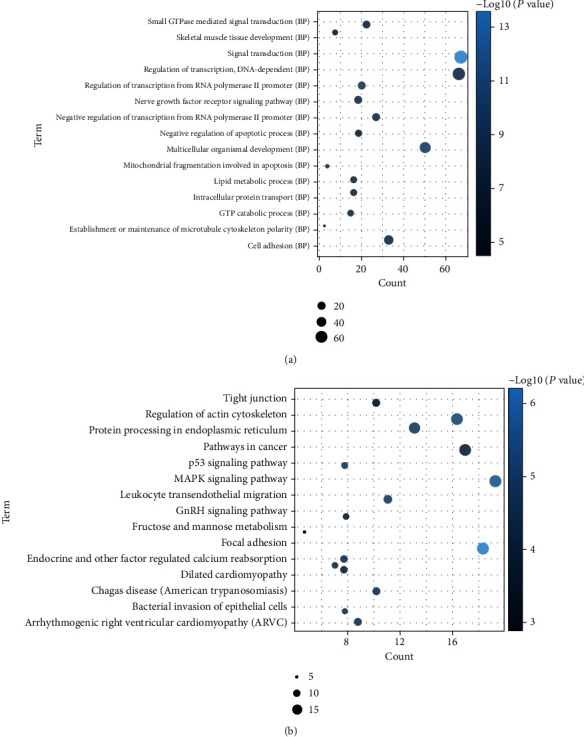
Figure 4.

Significantly enriched biological processes and KEGG pathways of differentially expressed mRNAs in ceRNA regulatory network. (a) BP: biological process. (b) KEGG pathways. The x-axis shows counts of host genes enriched in biological processes or KEGG pathways, and the y-axis shows biological processes or KEGG pathways.
