
Figure 6.
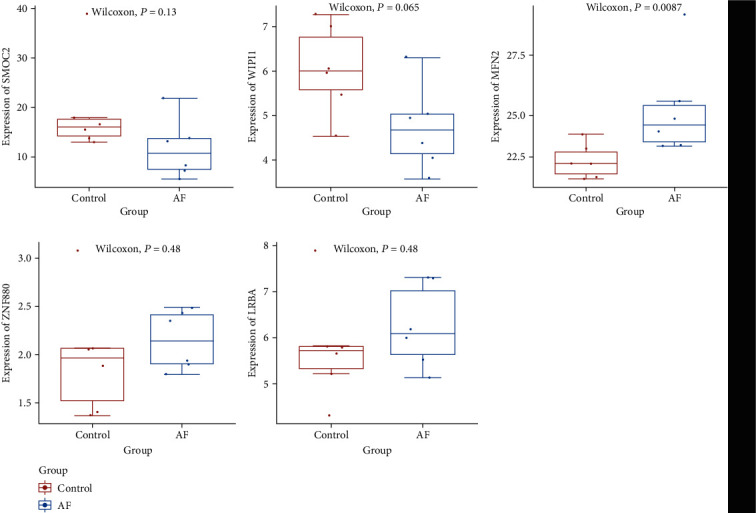
The box plots of SMOC2, WIPI1, MFN2, ZNF880, and LRBA in AF. The x-axis and the y-axis represent the group and expression of mRNAs, respectively.
Official websites use .gov
A
.gov website belongs to an official
government organization in the United States.
Secure .gov websites use HTTPS
A lock (
) or https:// means you've safely
connected to the .gov website. Share sensitive
information only on official, secure websites.
The box plots of SMOC2, WIPI1, MFN2, ZNF880, and LRBA in AF. The x-axis and the y-axis represent the group and expression of mRNAs, respectively.