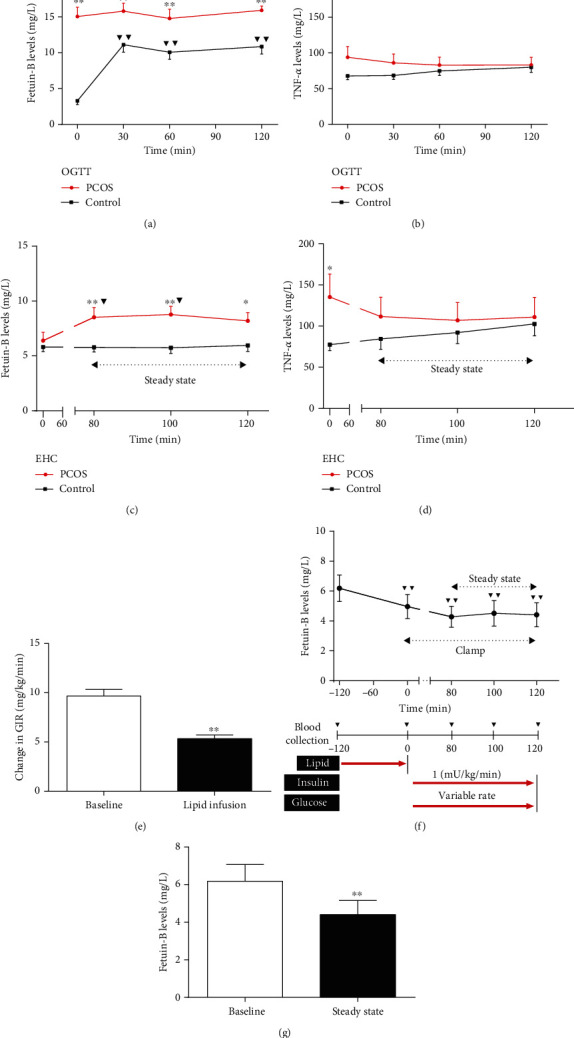
Figure 1.

Circulating Fetuin-B concentrations in interventional studies. (a) Circulating Fetuin-B concentrations in healthy and PCOS women during an OGTT. (b) Circulating TNFα levels in PCOS and healthy women during an OGTT. (c) Time course of circulating Fetuin-B changes in healthy and PCOS women during the EHC. (d) Time course of circulating TNFα changes in healthy and PCOS women during the EHC. (e) Glucose infusion rates (GIR) in control women at pre- and postlipid infusion. (f) Time course of circulating Fetuin-B changes in control women during lipid infusion combined with EHC. (g) Circulating Fetuin-B levels at pre- and postlipid infusion. Data are means ± SEM. ∗p < 0.05 or ∗∗p < 0.01 vs. control or baseline; ▼p < 0.05 or ▼▼p < 0.01 vs. baseline.
