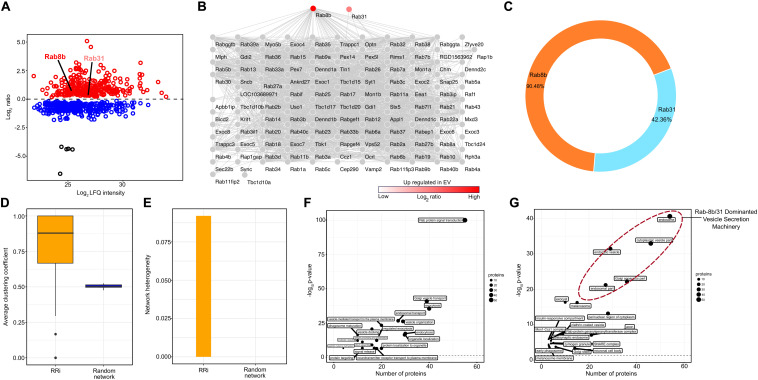
FIGURE 2.
Protein–protein network and pathway analysis of Rab8b and Rab31 proteins. (A) Scatter plot showing enriched proteins in EV in response to treatment with FGF2. Two Rab proteins Rab8b and Rab31 are upregulated (red color) in bFGF-induced EV proteome. (B) Network representation RRi derived from STRING DB. (C) Donut plot showing the percentages of direct and indirect interactions of Rab8b and Rab3. (D) Average clustering coefficient distributions for the RRi and random networks. (E) Network heterogeneity of RRi and random networks. (F,G) Scatter plot of enriched biological processes and KEGG pathways and cellular components of RRi. The –log10 P value indicates enrichment of pathway. Note: red color indicates upregulation.

