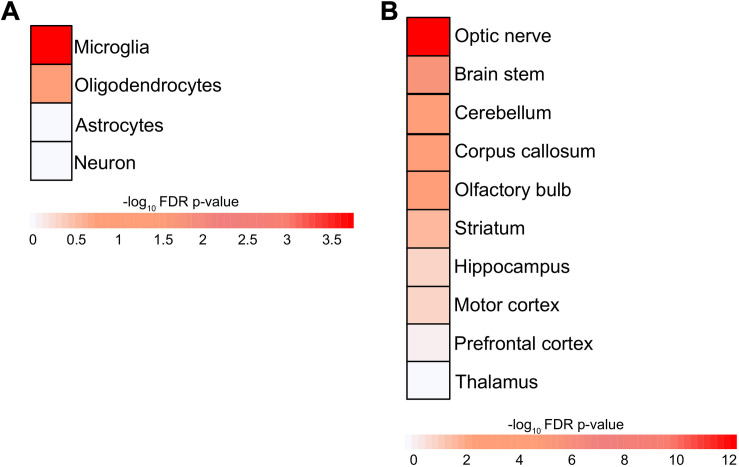
FIGURE 3.
Enrichment of brain cell types and region in RRi. (A) Heatmap representing the microglia, oligodendrocyte, astrocyte, neuron cell type enrichment. (B) Heatmap showing the enrichment of optic nerve, brain stem, cerebellum, corpus callosum, olfactory bulb, striatum, hippocampus, motor cortex, prefrontal cortex, and thalamus brain regions. The enrichments were assessed using Fisher’s exact test and negative log10 Benjamini–Hochberg-adjusted P values; statistical significance cutoff was set at 1.31 and is comparable to the P values ≤ 0.05.

