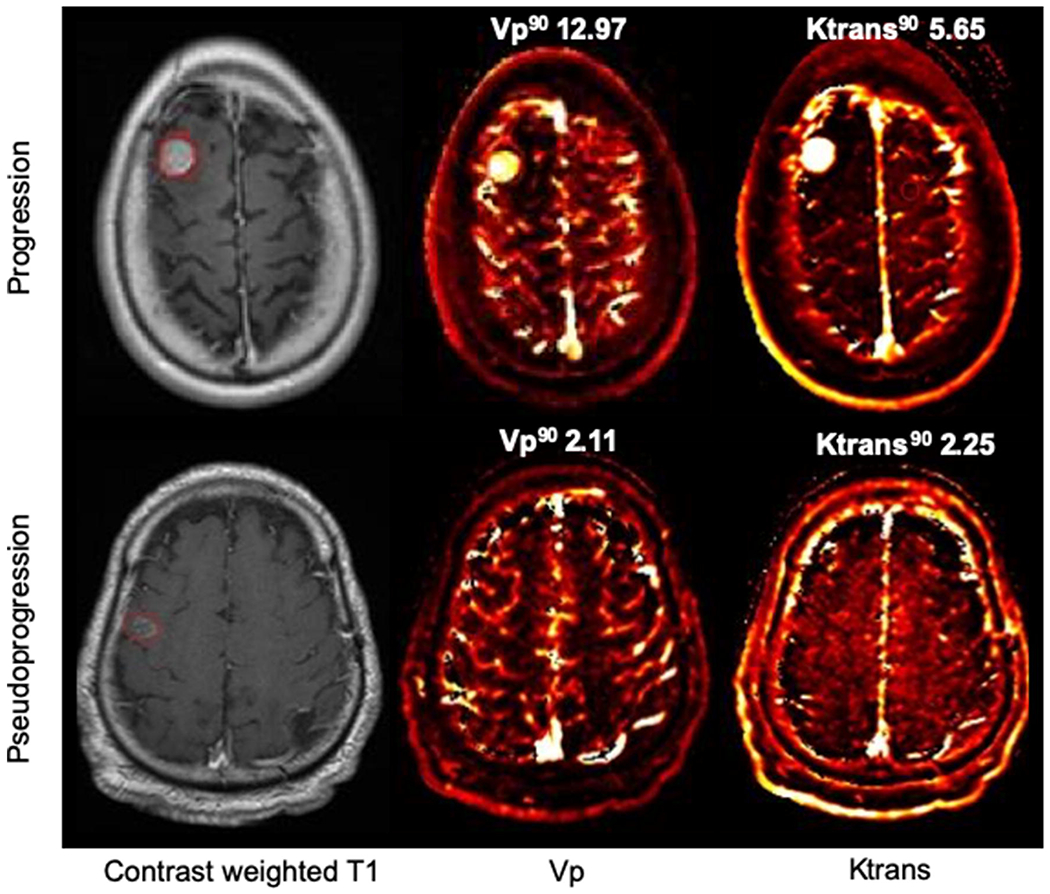
Figure 3.

DCE-MRI perfusion scans
In progression (top row), T1 contrast enhancing lesion has corresponding elevated Vp90 and Ktrans90 on DCE-MRI perfusion scan. In pseudoprogression (bottom row), the contrast enhancing area has lower corresponding Vp90 and Ktrans90 values.
