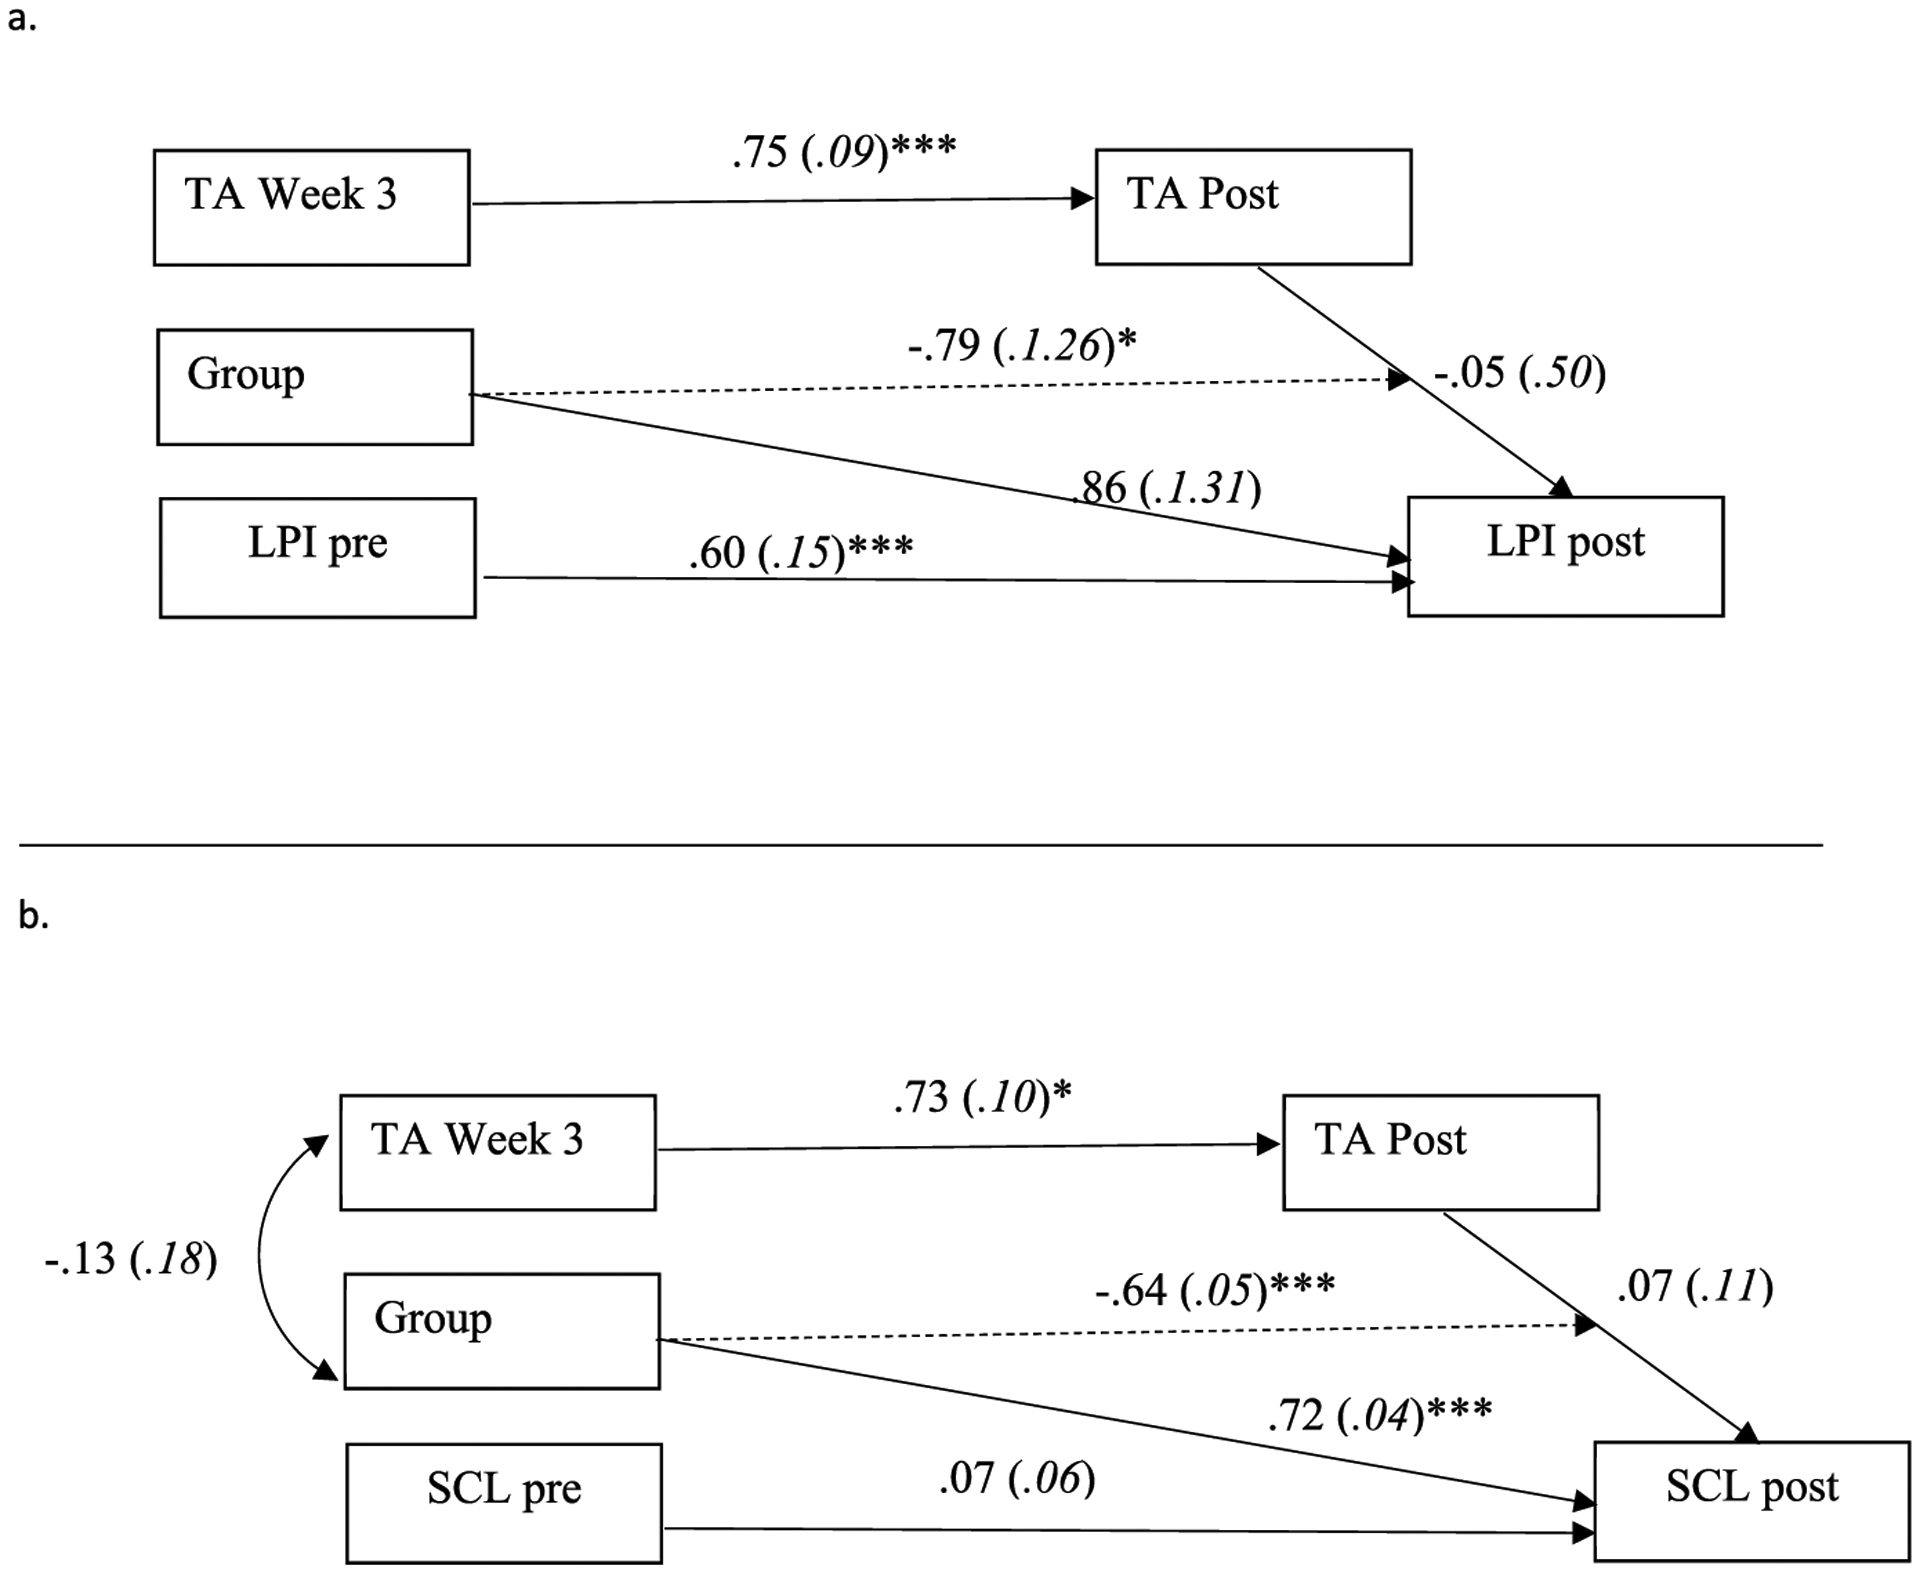
Fig. 3.

Path Models Demonstrating a Relationship between Posttreatment Therapeutic Alliance (TA Post) and Life Problems Inventory (LPI; panel a) and Symptom Checklist- Depression (SCL; panel b) Outcomes when Accounting for Baseline TA and Outcome. Dashed Lines Indicate Moderation Paths. Group (DBT = 1; PPT = 2). Paths Represent Standardized Regression Weights with Standard Errors in Parentheses. Note. * = p < .05; *** = p < .001.
