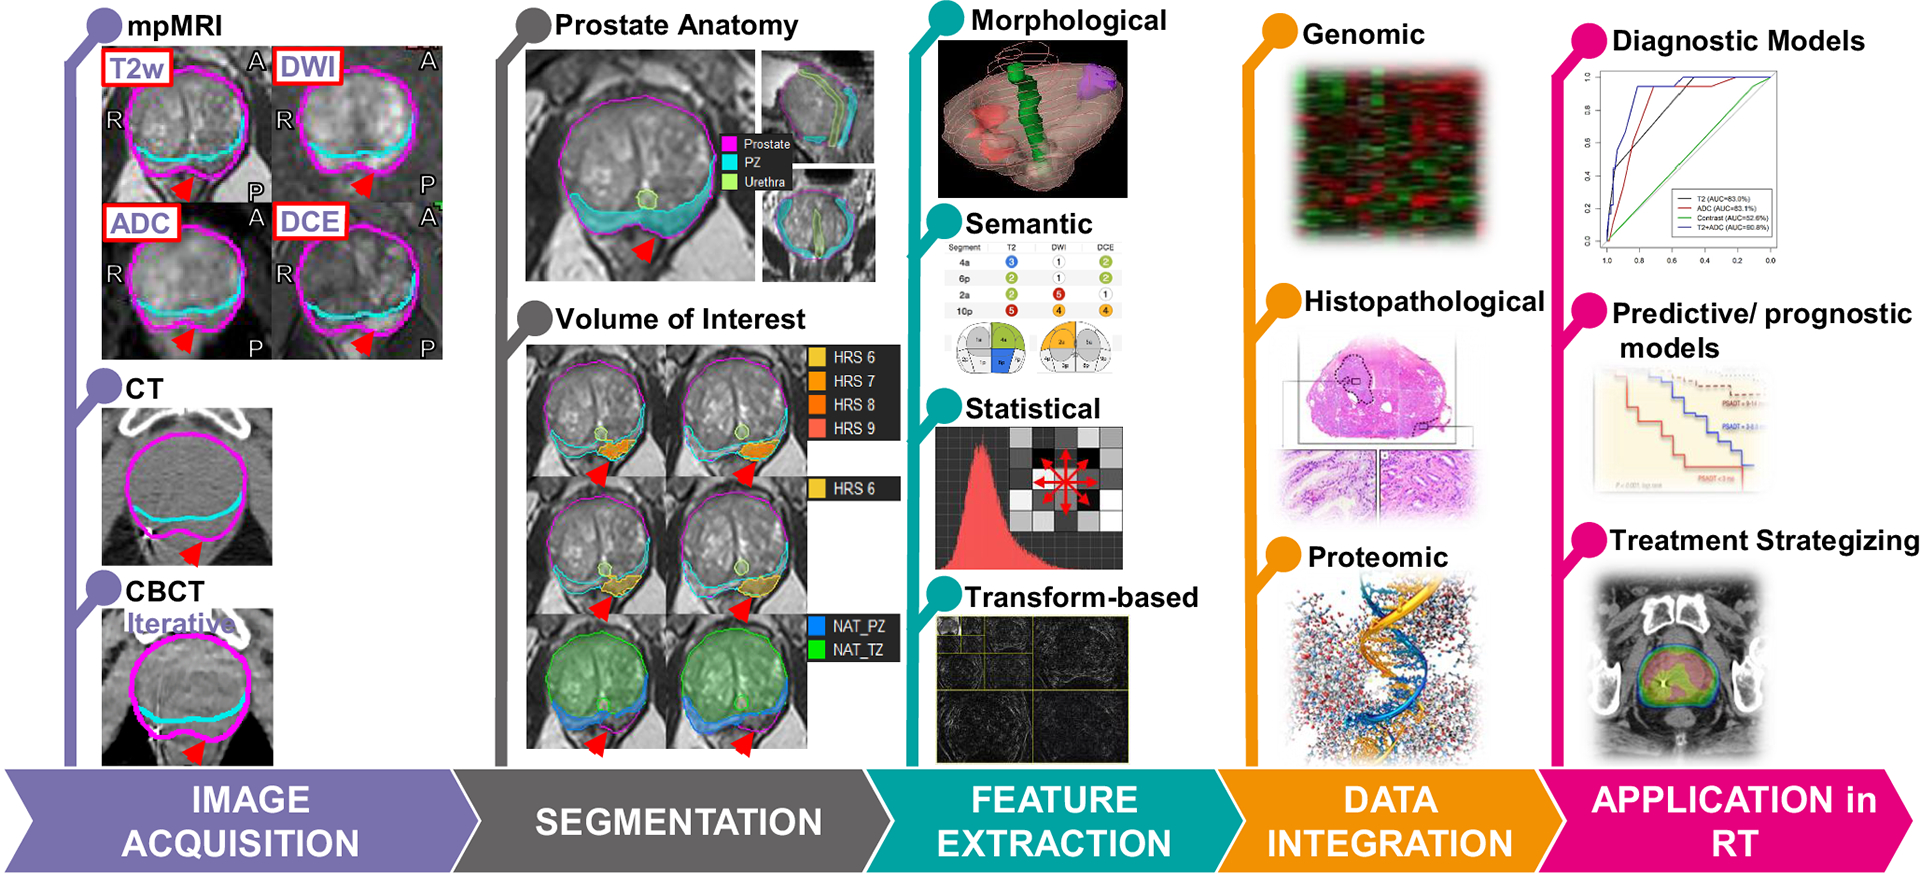
Figure 2. The radiomics workflow in RT of prostate cancer.

Image Acquisition: Image modalities, mpMRI, CT and CBCT from the same prostate cancer patient are shown. The red arrow points at the tumor. Segmentation: Prostate, urethra, peripheral zone (PZ), and transition zone (TZ), as shown in the top panel, are contoured. Habitat Risk Score (HRS), displayed as a heat map on the T2-weighted MRI indicates the tumor. HRS6 volume is selected for volume of interest (VOI) for radiomics features extraction (HRS6 also defines gross tumor volume (GTV)). Normal Appearing Tissues (NAT) in PZ and TZ are obtained by subtracting VOI from PZ and TZ. Feature extraction: The radiomics features typically belong to one of four categories shown. Data integration: Radiomics features are integrated with other available biomarkers, such as data from clinical records, genomic profiling, proteomic screening, and physiological analysis. Application in RT: Integrated data/models are used to aid in diagnostic assessment, to facilitate patient-individualized treatment strategizing, and improve predictive and prognostic accuracy.
