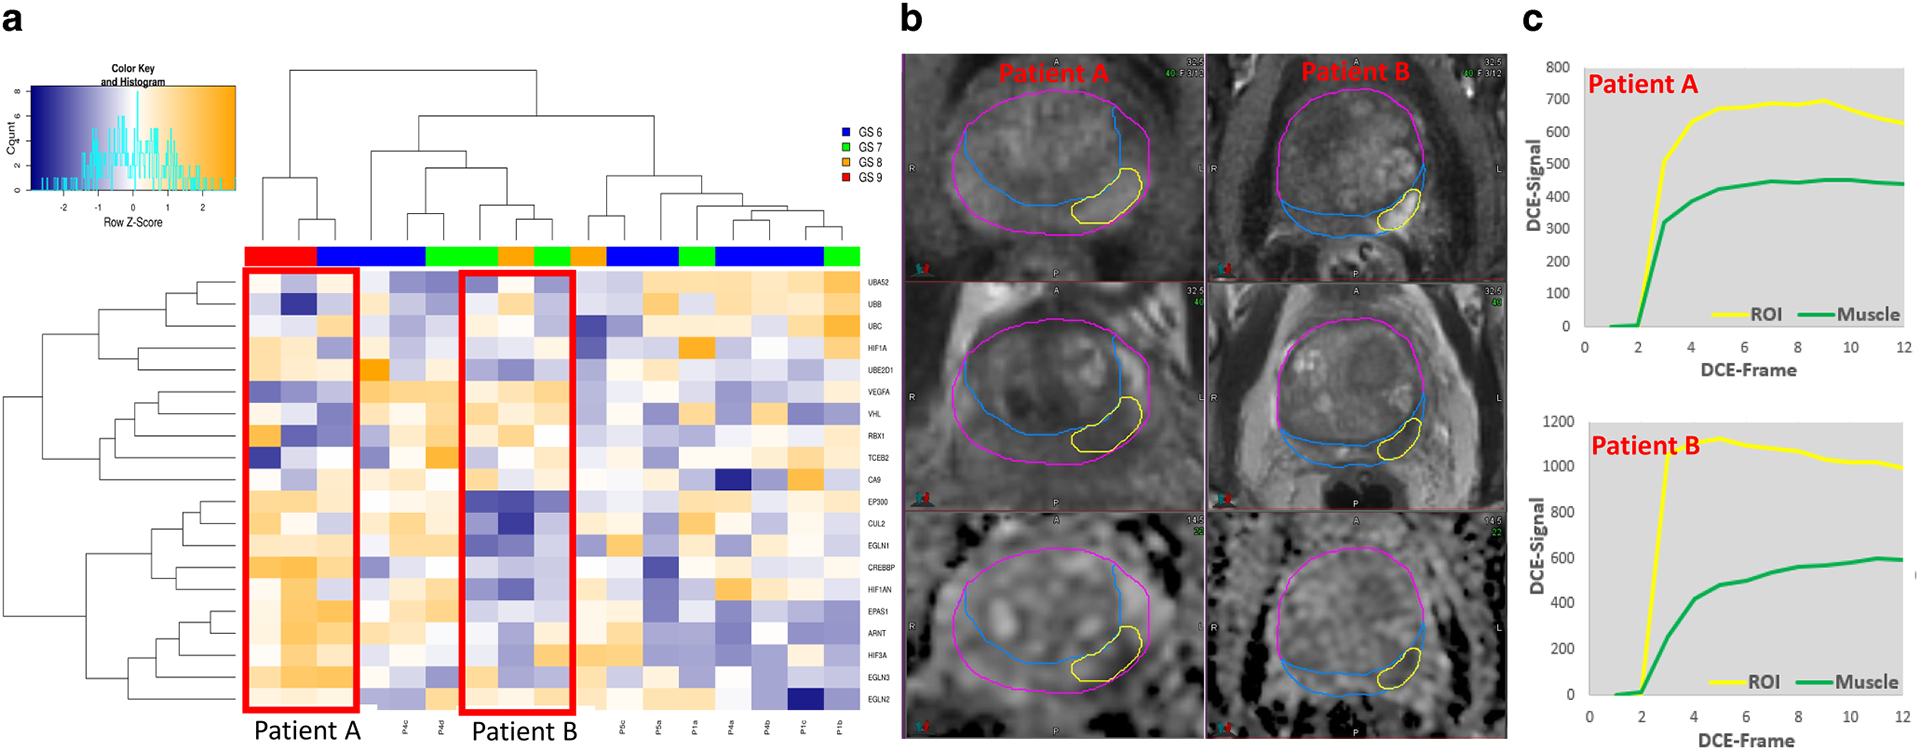
Figure 7. Association of Dynamic Contrast Enhanced (DCE-) MRI with hypoxia.

a) Hierarchical clustering on expression of the twenty hypoxia genes in 17 biopsies from 6 patients. Each sample is color-coded based on Gleason Score (GS). The two main clusters of genes were driven by the biopsy cores (n = 3) from two patients with high risk (marked with red boxes, Patient A and Patient B) Hypoxic genes, such as HIF3A, EPAS1, CUL2, EP300 are upregulated in the tissue from Patient A and vice versa, downregulated in the tissue from Patient B. b) Early enhancing series on DCE-MRI and corresponding T2-weighted and Apparent Diffusion Coefficient (ADC) images from Patient A and B. The enhancement is more pronounced in Patient B, suggesting well-perfused tumor. c) DCE-curves in the tumors, referenced to DCE signal in muscle (Gluteus Maximus). The tumor DCE-curves in Patient A are characterized with slower contrast uptake and moderate enhancement, characteristic for hypoxic tumors. On the other hand, in Patient B contrast uptake is hast and with high amplitude, suggesting well perfused tumor. Note that the muscle contrast-uptake amplitude is almost the same for the two patients.
