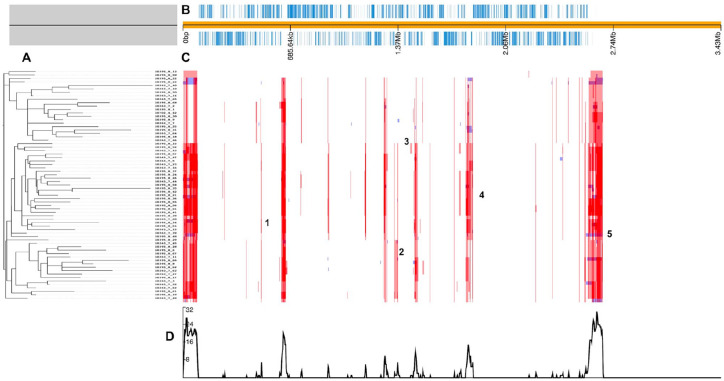
Figure 3.
Recombination hotspots in whole-genome alignment: (A) the phylogenetic tree was computed on recombination sites free alignment and was generated by GUBBINS. (B) Functional annotation of the consensus sequence where the light blue spots represent the mapping of the predicted CDS. (C) The detected recombination hotspots: red blocks represent ancestral recombination while the blue blocks represent specific recombination to one isolate. Recombination hotspots overlapping with virulence genes are labeled with a number: 1, 2, 3, 4, and 5, respectively, corresponding to cps2L, slrA, piaA, cpbE/pce, and lmb, respectively. (D) The bottom part of the figure corresponds to a graph measuring SNP density.

